
Finding samples: filter chip history by what was measured
Most questions about chip quality start as a hunch. Has this supplier's bark crept up since the spring? How many of last month's softwood loads were over target on fines and pins together? Which samples came in without a moisture test? Answering them usually means exporting a spreadsheet and filtering it by hand.
In The Chip Lab every sample your mill has recorded stays searchable, and the filter works on the measurements as well as the paperwork.
Where to find it
Under Chip Data in the menu: View Sample Data opens the Samples grid, View AVG Sample Data opens the averages, and Sample Groups lists the sets your mill has saved. Everyone who can see your mill's samples can use all three. (Someone with Contributor access enters samples and sees only their own, in the Your entries list on the entry page.)
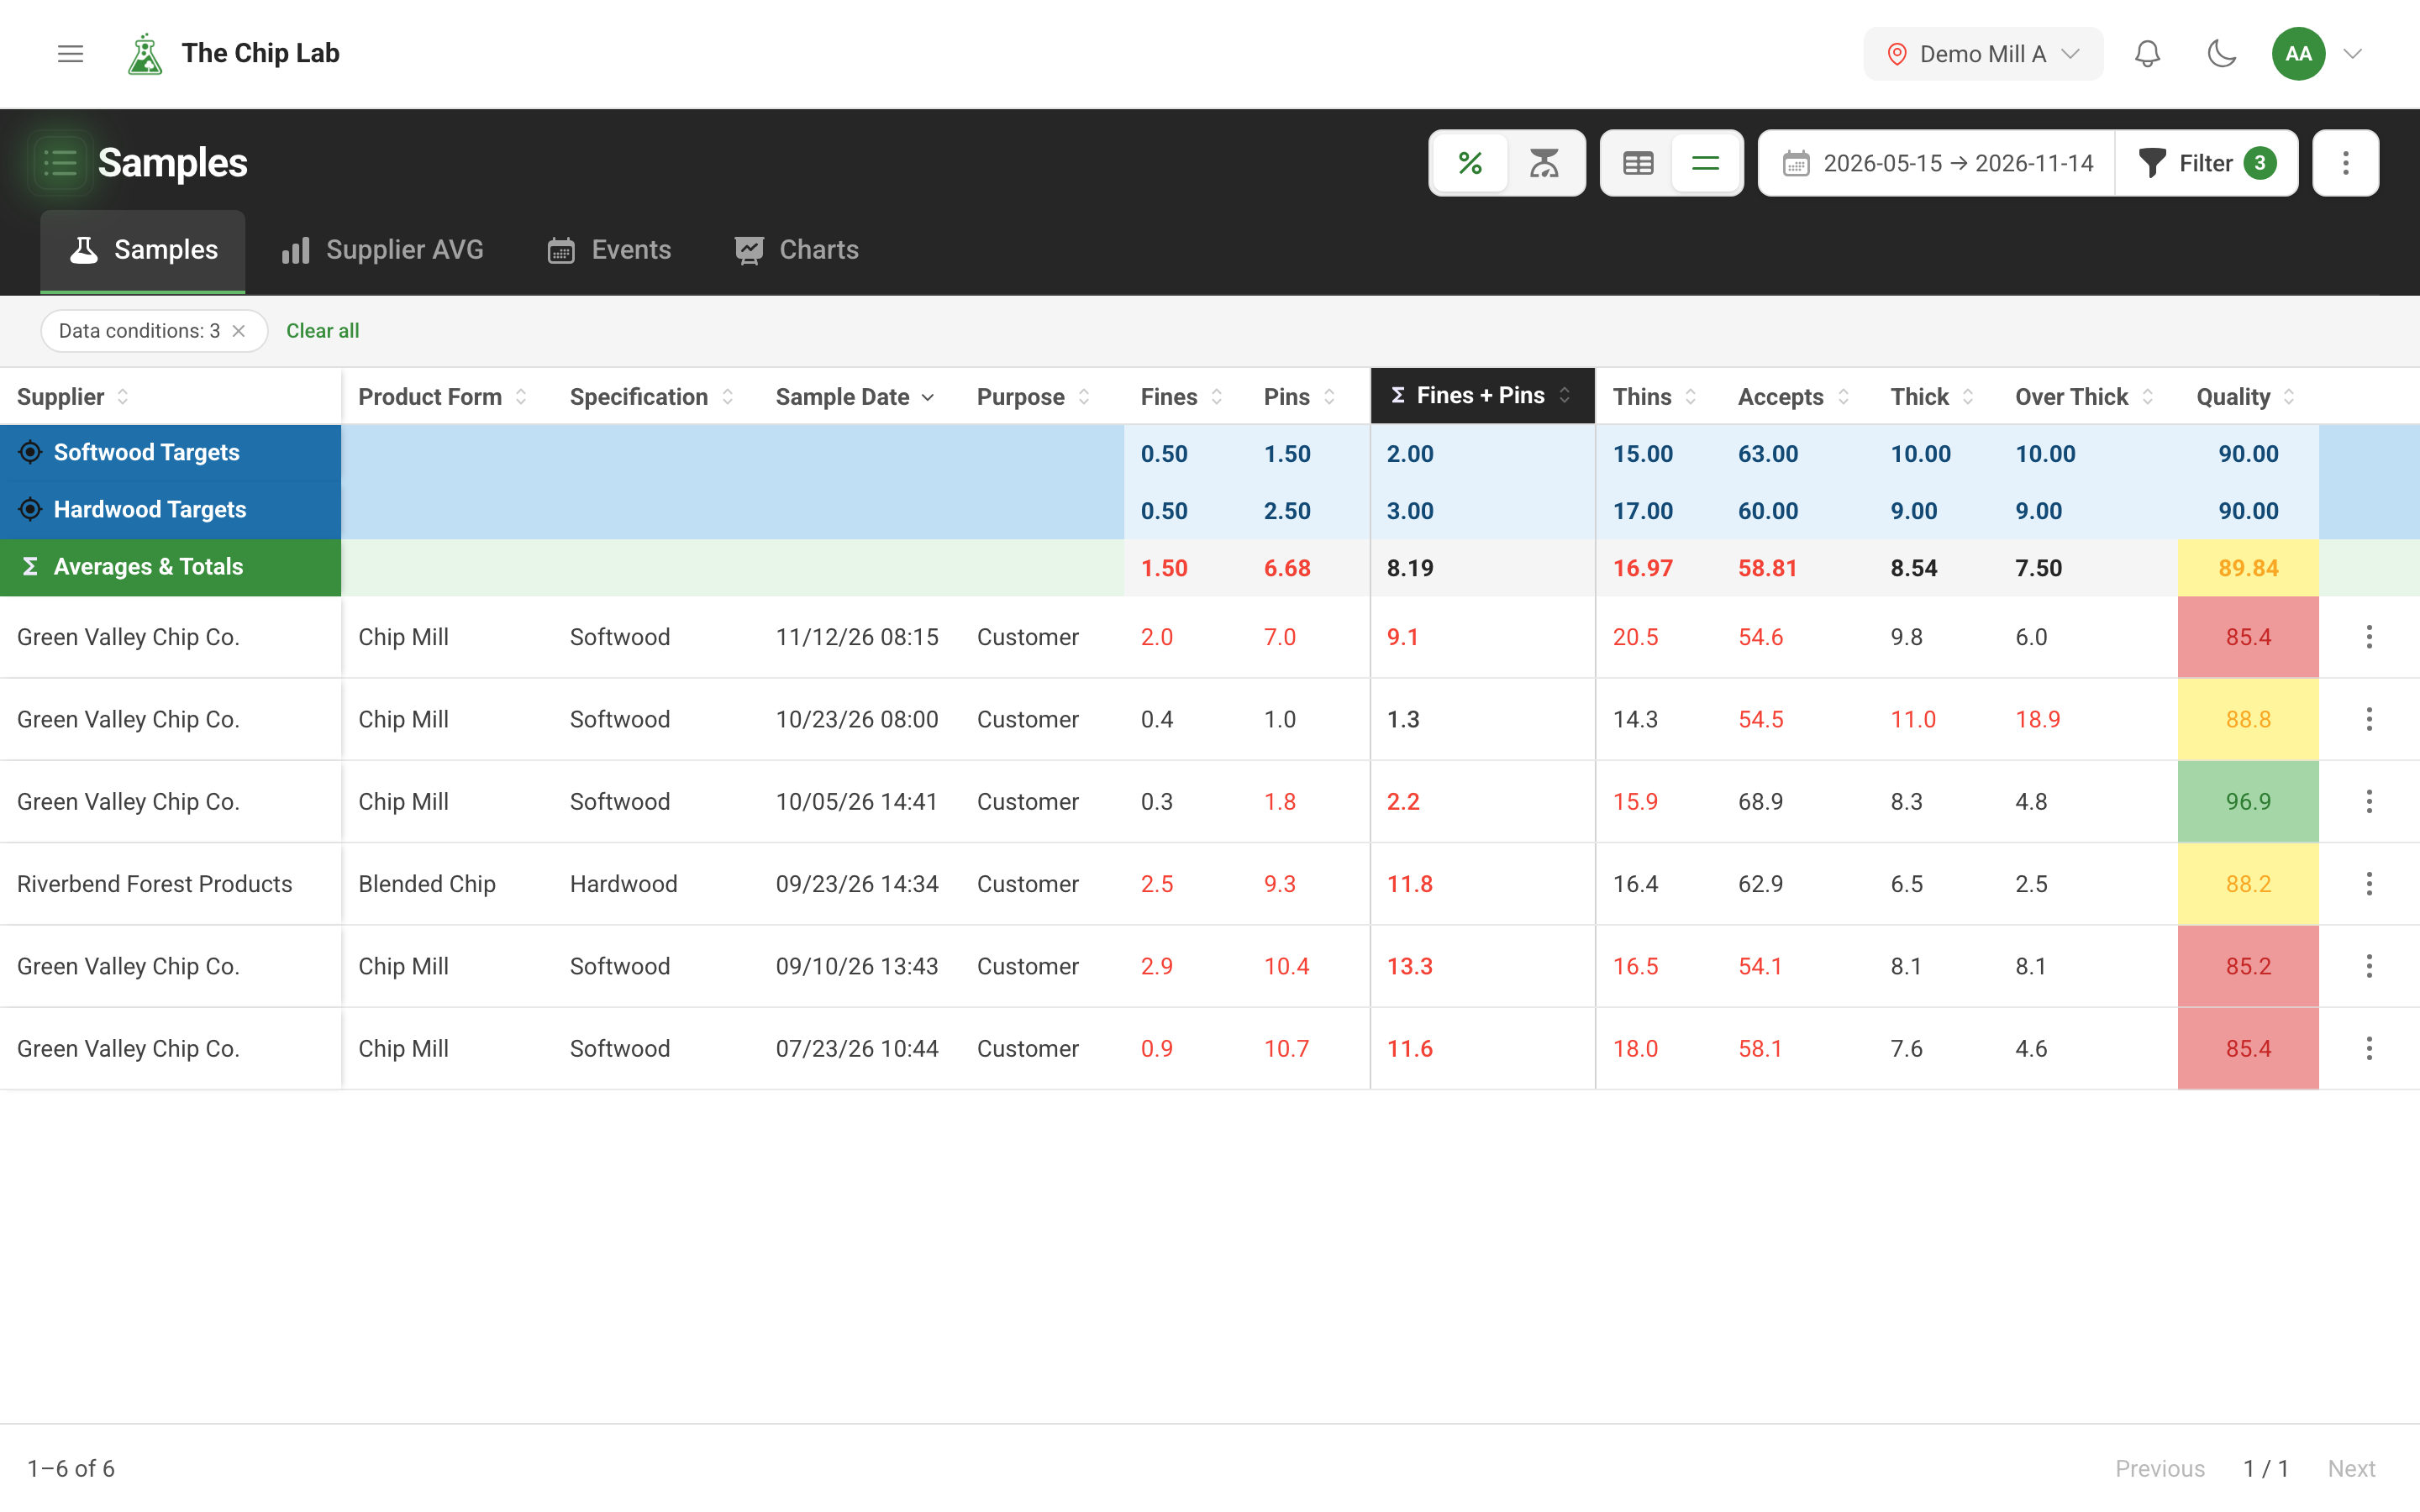
Pick a date range or open Filter, and the grid fills with the matching samples: one row per sample, a blue Targets row for each specification in view, and an Averages & Totals row. Values outside the specification are red, and the quality column is colored by rating. The tabs beside Samples show the same result as Supplier AVG, Events and Charts, and More actions downloads it as a spreadsheet (Exporting data).
The filter panel
Filter opens Sample Filters. The top half is the familiar scoping: dates and sample limits (including "the most recent N per supplier"), Specifications, Sample Purpose and Suppliers — by name, supplier group, supply type or product form. Mill users can pick any of the mill's supplier groups; a supplier login is offered only the groups it can view (see Supplier groups). Test ID Look-up finds specific samples by test ID or sample ID, regardless of any other filter.
Data conditions: filter on the measurements
Below the scoping sits Data conditions. Add conditions opens a focused editor: choose a property on the left, then set its comparison and value on the right. Only the properties your specifications use are offered: every measurement on the sample, the comment text, and generated values such as recoverable fiber. Sample attributes sit beside them, among others Operator and, on the Samples page, Entered by (who typed in a manual entry) and On hold. Samples waiting for review are left out unless On hold asks to include them, or to show only them.
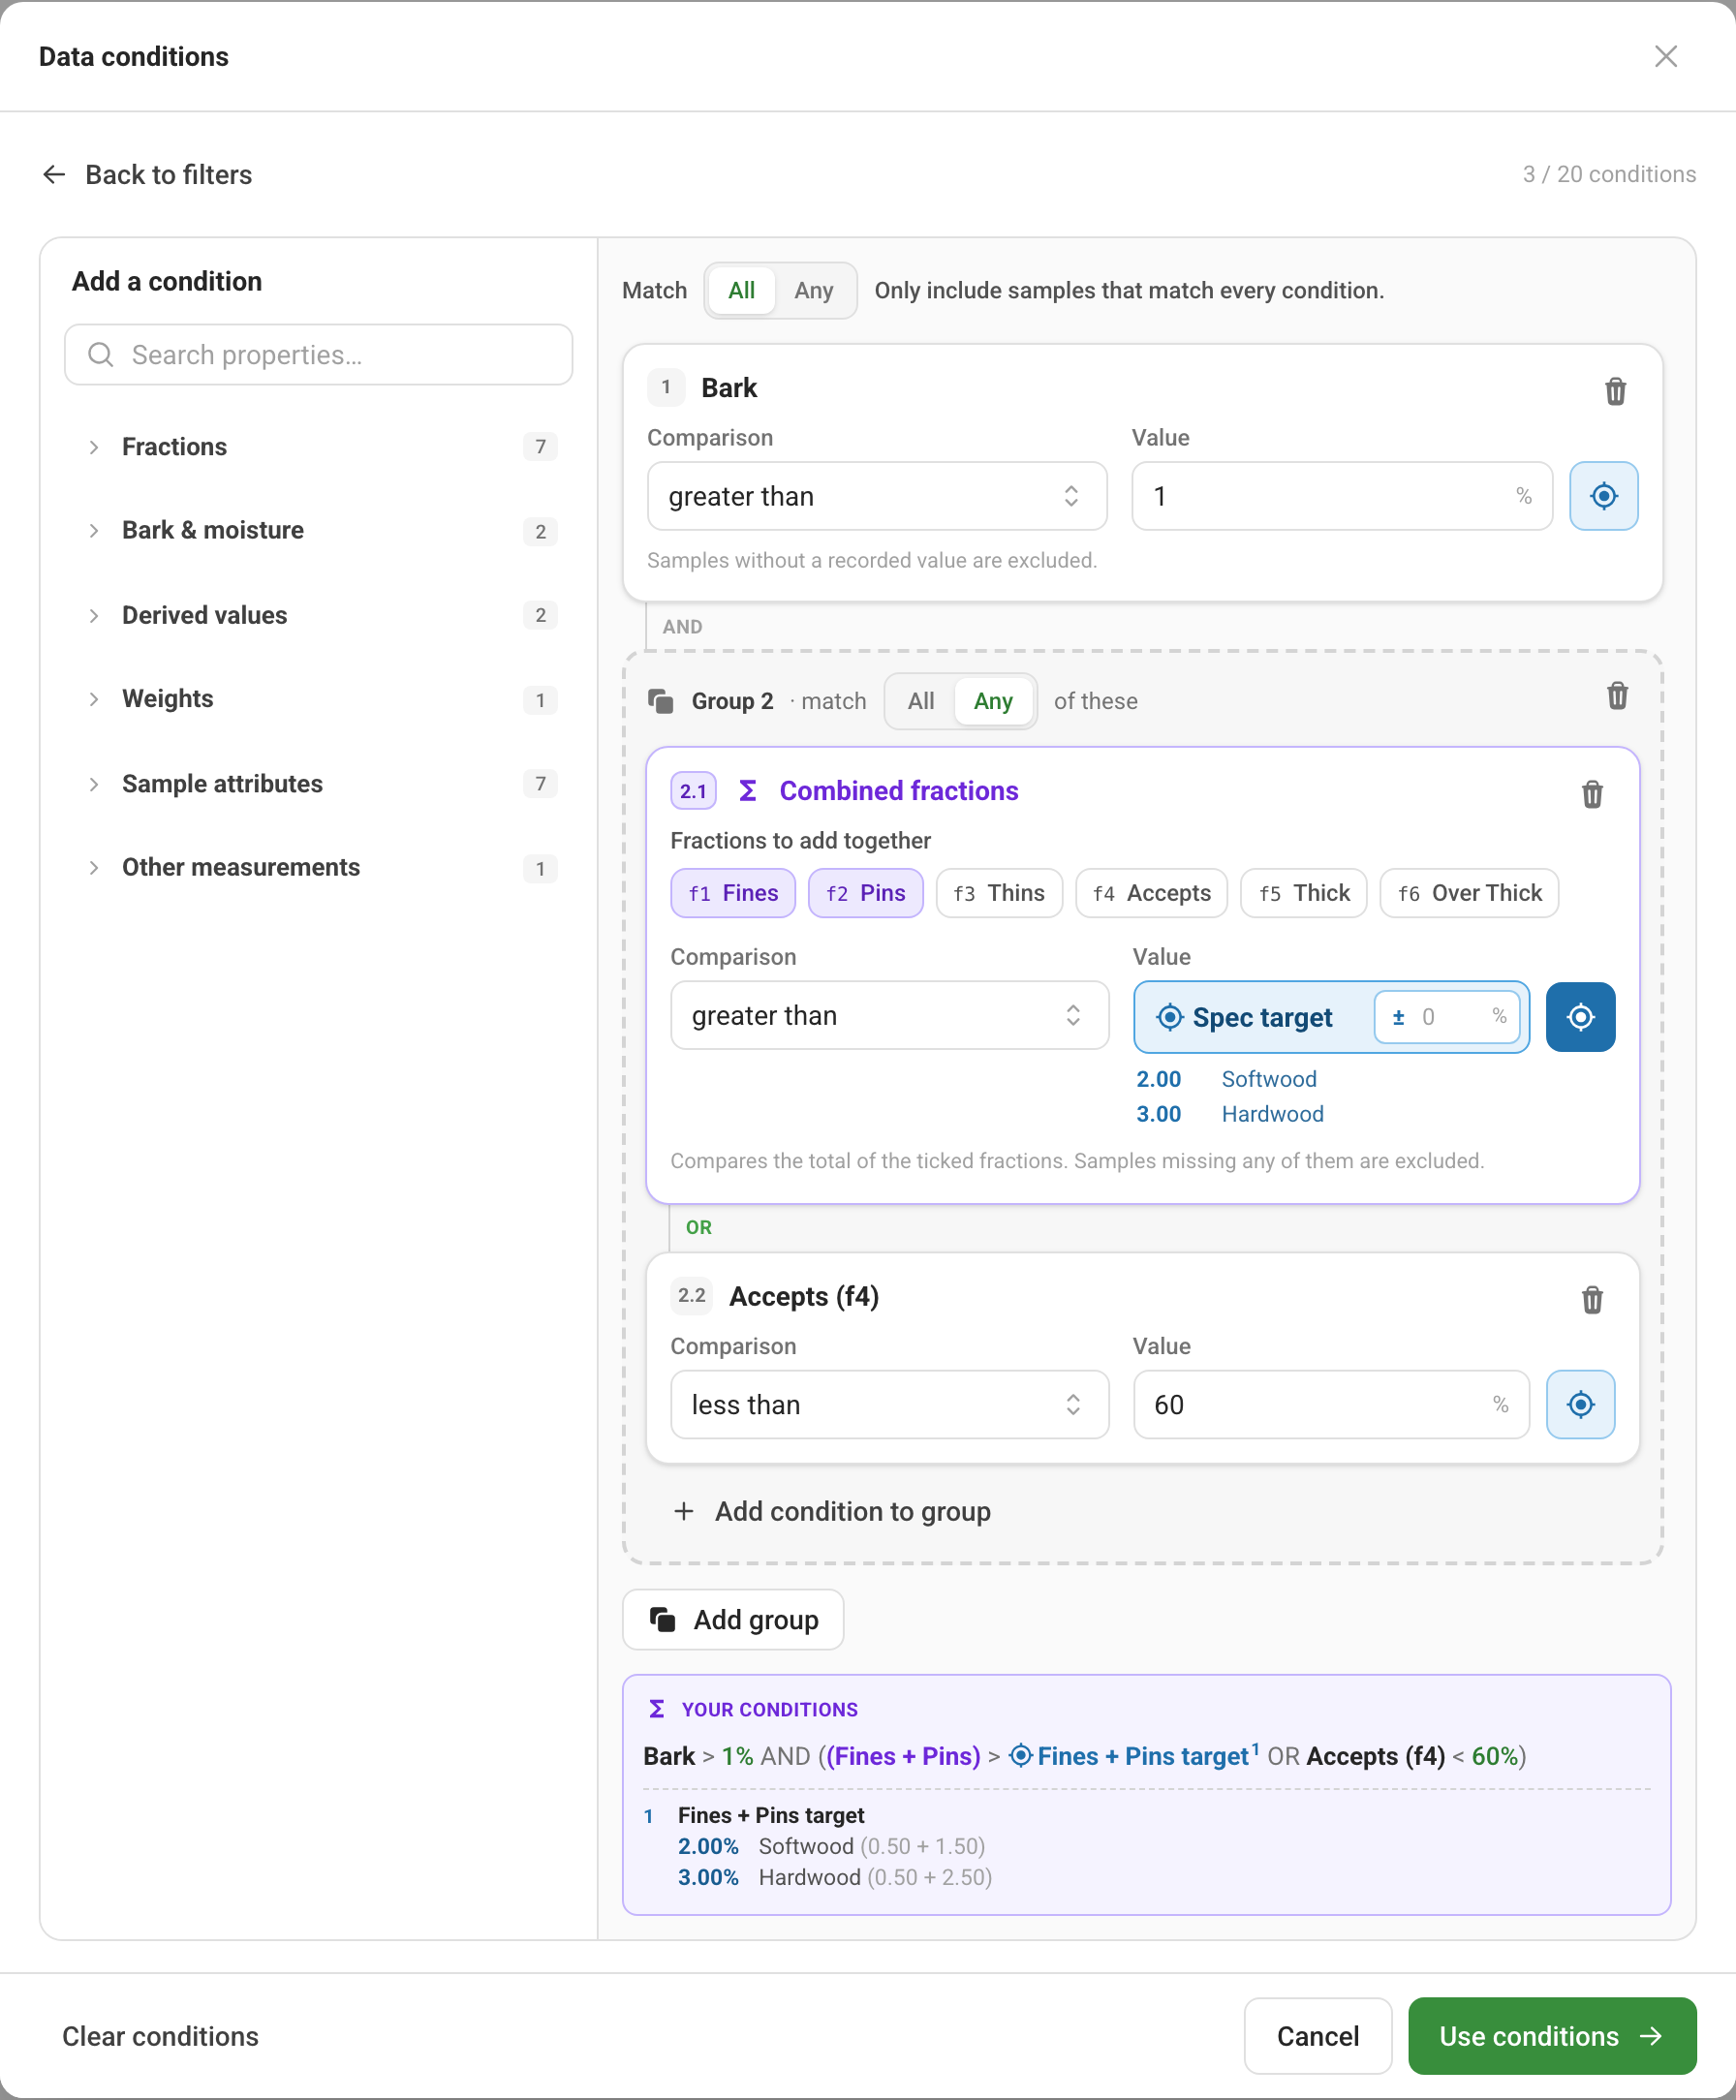
All or any, and groups. Match decides whether a sample must meet every condition or at least one. Add group puts several conditions in a box with its own All/Any, so you can ask for bark over 1% AND (fines + pins over target OR accepts under 60%) in one filter. Up to 20 conditions can be combined.
Combined fractions. Tick two or more fractions — fines and pins together, say — and compare their total. The total then appears as an extra Σ column in the grid, the averages and the downloaded spreadsheet.
Compare with the spec target. The target button beside a value switches it to Spec target: each sample is compared with the target of its own specification, with an optional offset (fines more than 0.5 above target). Each specification's target is listed underneath, and a saved filter follows the targets if they change later.
Missing tests. Measurements and the comment field also offer Is missing and Has a value, so you can find the samples where a test was never recorded, or keep only the ones where it was.
Underneath, Your conditions reads the whole filter back as a sentence before you press Use conditions. The same filter panel, conditions included, is used when you set up an alarm.
Averages over time
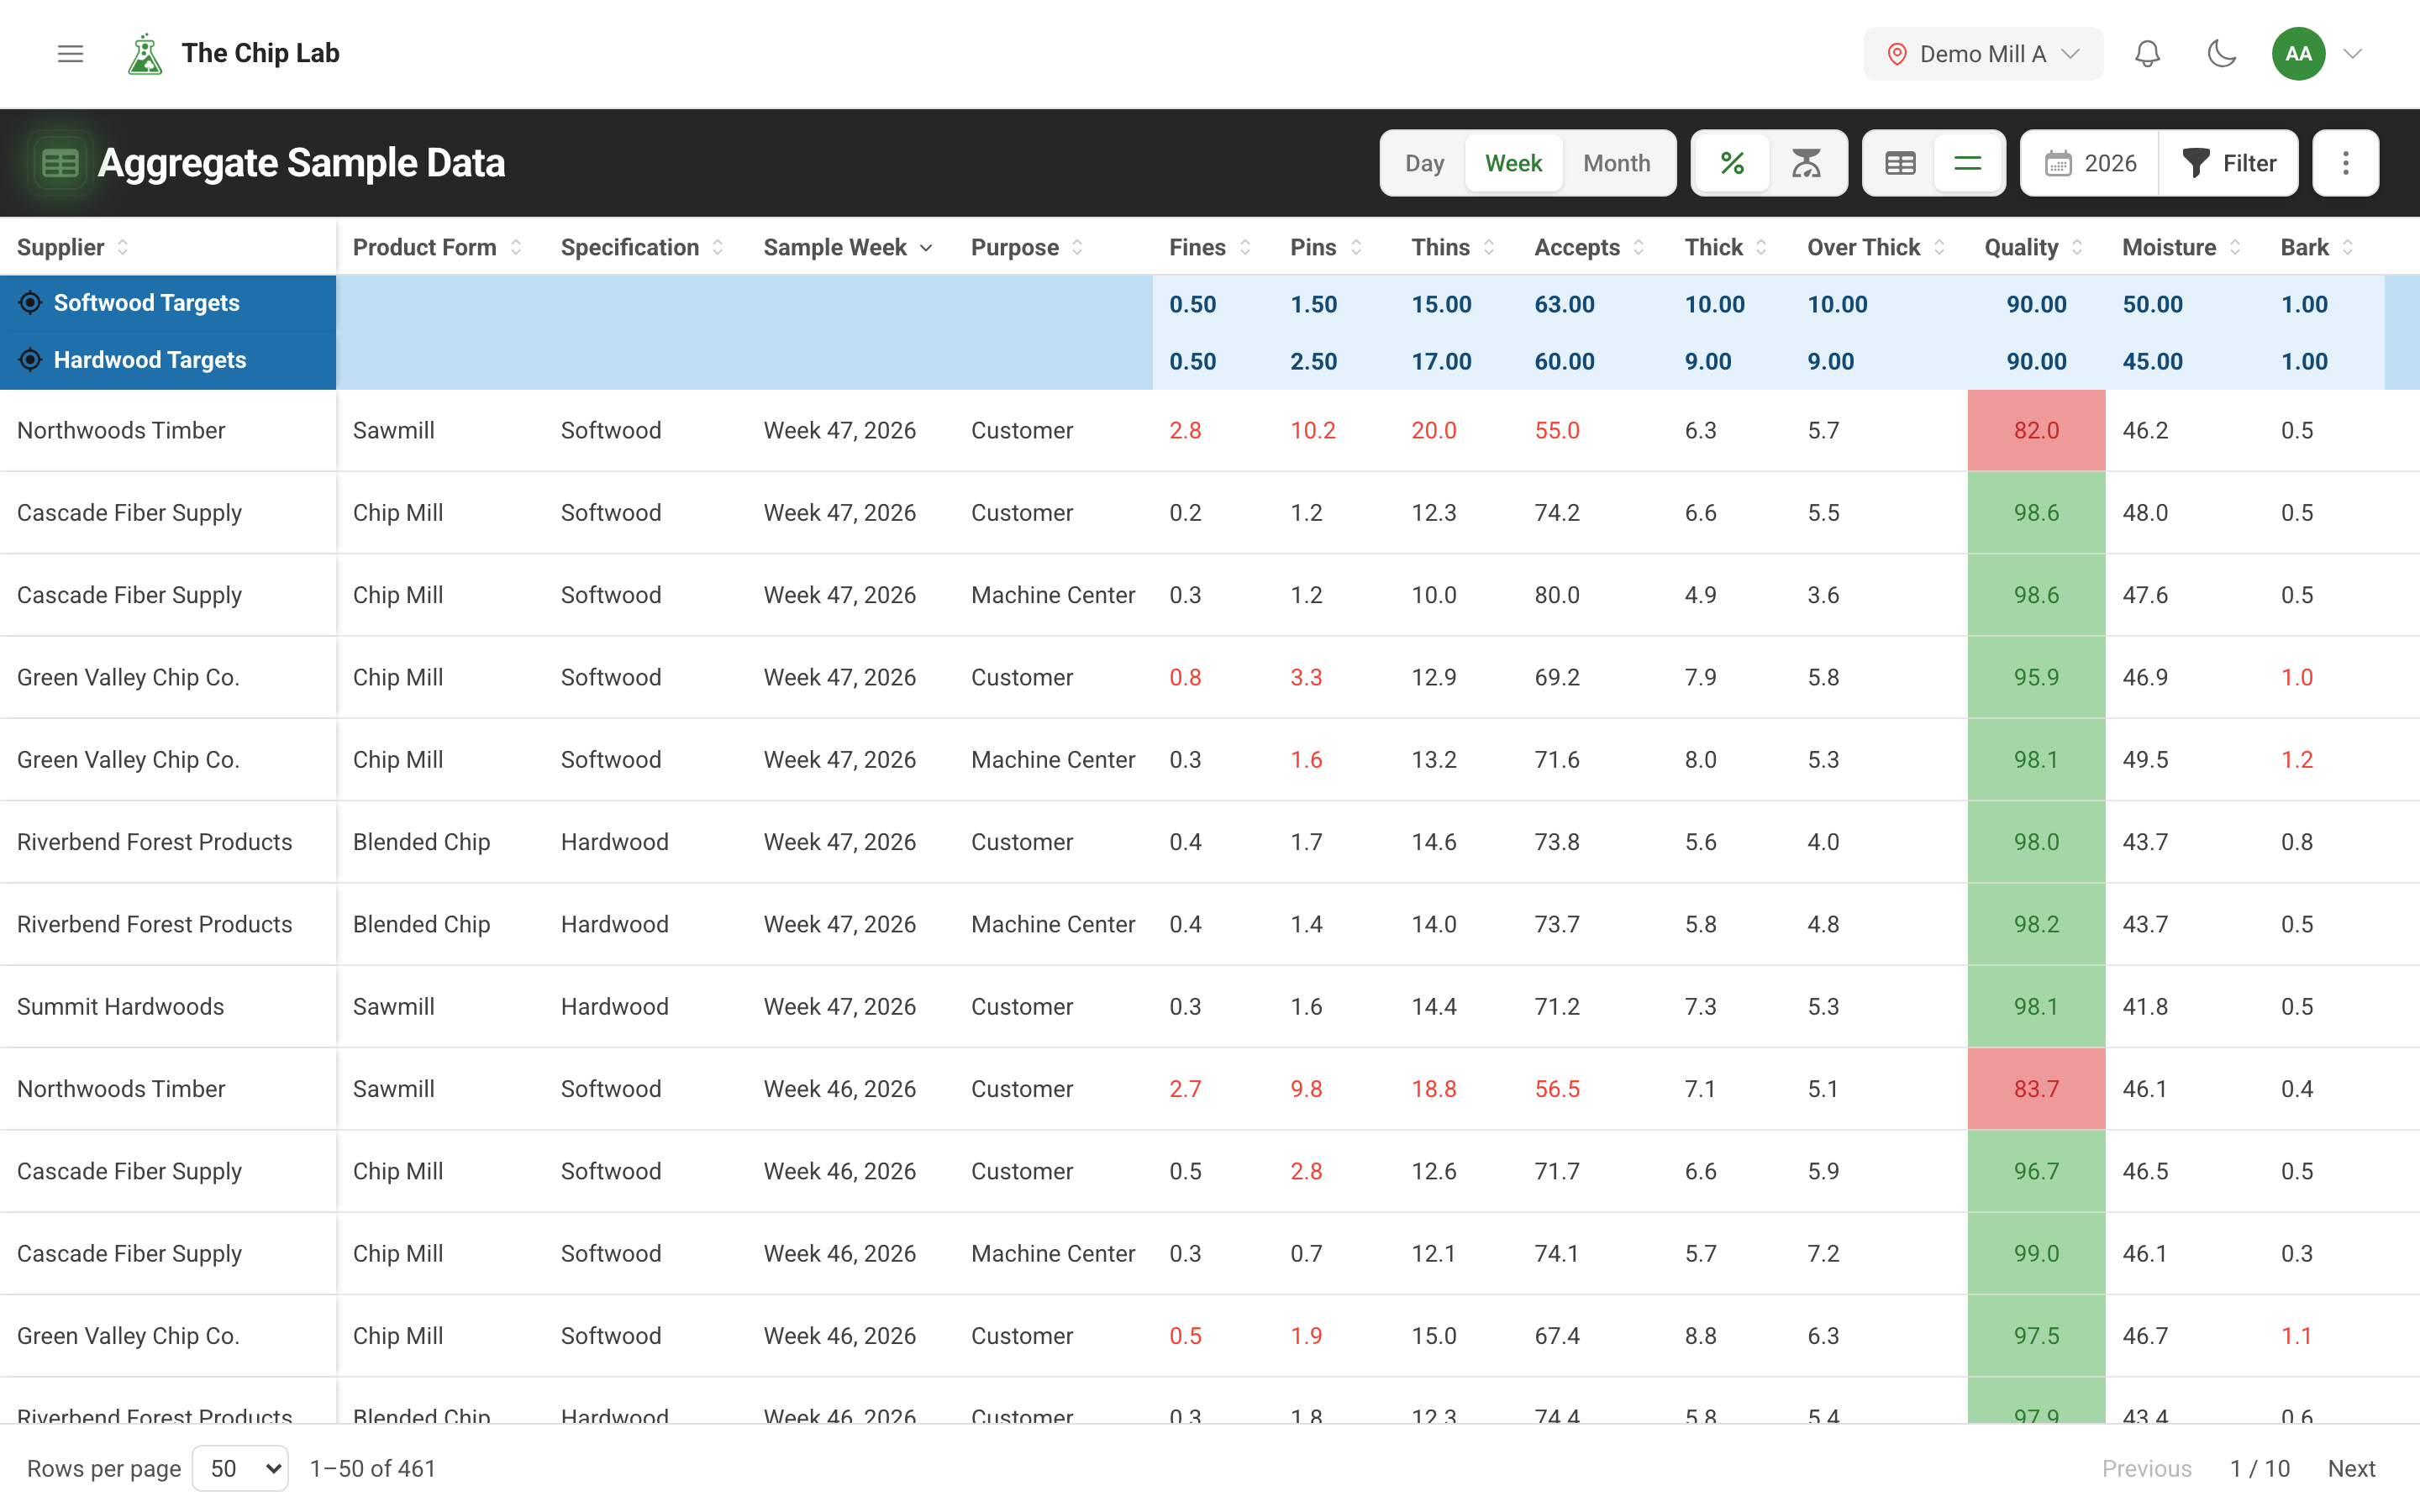
View AVG Sample Data opens Aggregate Sample Data: pick a year and switch between Day, Week and Month to see one averaged row per supplier, specification and sample purpose for each period, with the same filter panel and data conditions (On hold and Entered by are the Samples page's own).
Sample groups: keep a set and talk about it
When a set of samples is worth coming back to — the loads behind a complaint, a trial of a new chipper setting — select them on the Sample Management page and choose Group. Creating sample groups requires mill-wide Chip Data at Reviewer or above; supplier-side grouping is additionally limited to samples the person may edit, and a login affiliated only to one supplier cannot create groups. A group has a label, a description and tags, and holds samples from one specification.
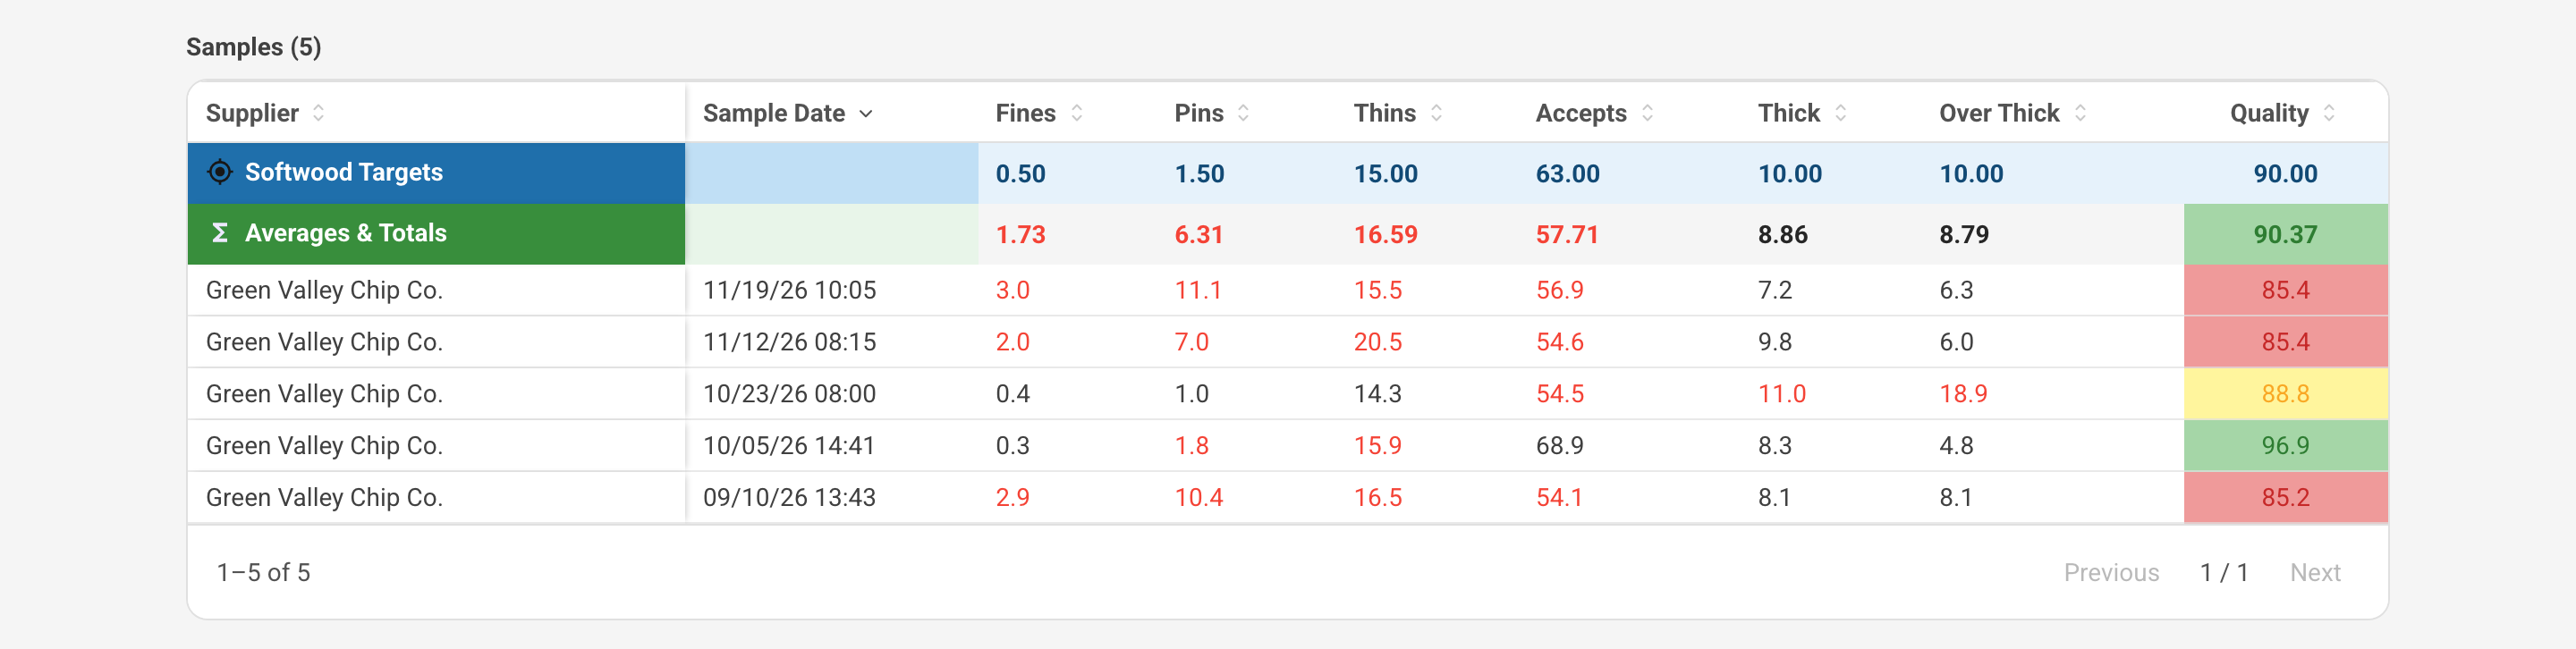
Each group has its own page. Overview shows the group's details, its samples with their targets and averages, and distribution and trend charts. Comments is a threaded discussion, so the conversation about those loads stays with the numbers it is about.
Read next
- How samples are reviewed and approved — what happens to a sample before it shows up here, and how Sample Management works.
- Manual sample entry
- Exporting chip sample data and supplier averages to Excel
- Supplier groups