
Exporting chip sample data and supplier averages to Excel
Sooner or later the numbers have to leave the system: a quarter of one supplier's loads for a supplier meeting, a trial write-up, a cost model kept in a workbook. Copying rows off a screen does not scale.
In The Chip Lab, the pages that show your samples and their averages can also download them as a spreadsheet, narrowed by the same kind of choices you use to search.
Where to find it
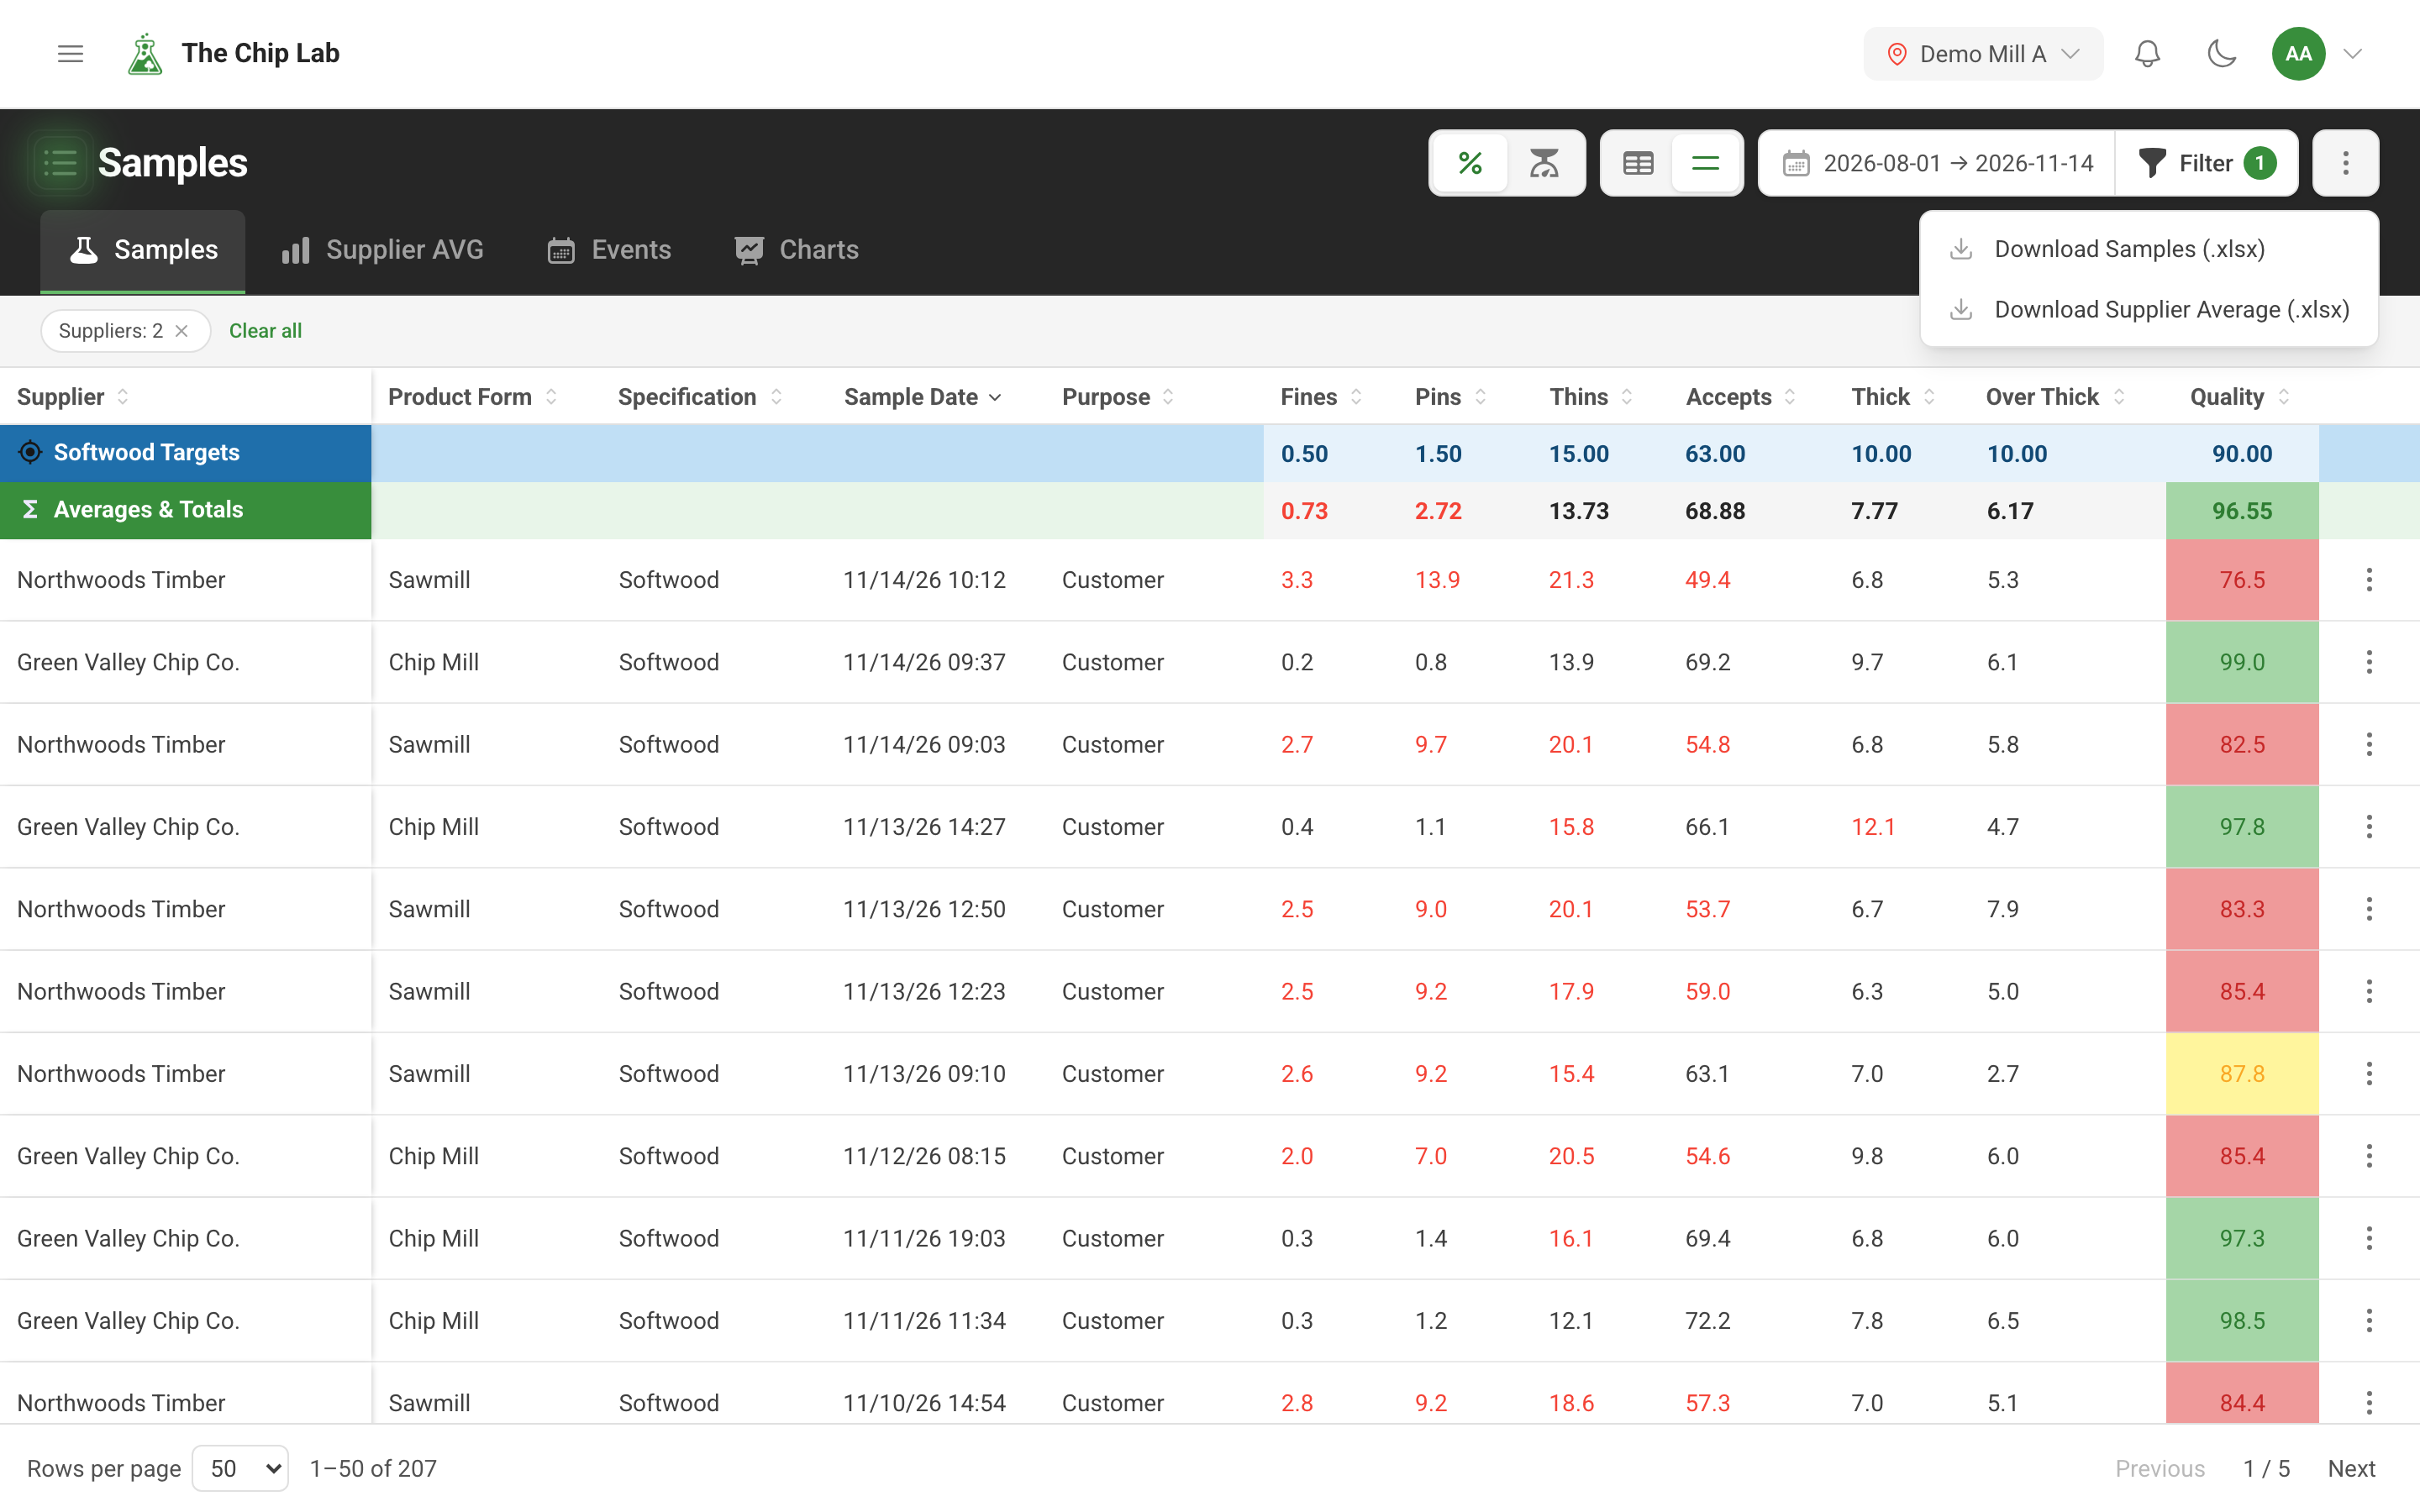
Under Chip Data in the menu, View Sample Data opens the Samples grid and View AVG Sample Data opens Aggregate Sample Data. On both, the More actions button at the right of the toolbar holds the downloads. How to narrow a search — dates, suppliers, specifications, data conditions — is covered in Finding samples.
What you can download
From the Samples page:
- Download Samples (.xlsx) — the page's samples as rows of a spreadsheet.
- Download Supplier Average (.xlsx) — the samples averaged per supplier, specification and sample purpose, with how many samples each average is built from.
From Aggregate Sample Data, the download follows the period you picked: Download Daily Average (.xlsx), Download Weekly Average (.xlsx) or Download Monthly Average (.xlsx), one averaged row per supplier, specification and sample purpose for each period of the year.
Files are Excel workbooks (.xlsx), named after your mill, the date and what they hold — for example Weekly Average Samples — so a folder of exports stays readable. They open in Excel and in other programs that read .xlsx files, and the plain layout — one header row, then one row per record — is easy to bring into other systems.
Narrowing what you download
There is no separate export screen to set up. On the Samples page, choosing suppliers, a date range, specifications and data conditions narrows what is downloaded:
- By supplier — pick one supplier, several, or a supplier group, supply type or product form. A supplier login is offered only the supplier groups it can view.
- By date range — the range in the toolbar, or the most recent N per supplier with Per-supplier limit.
- In bulk — leave the suppliers open and the file holds samples from across your suppliers.
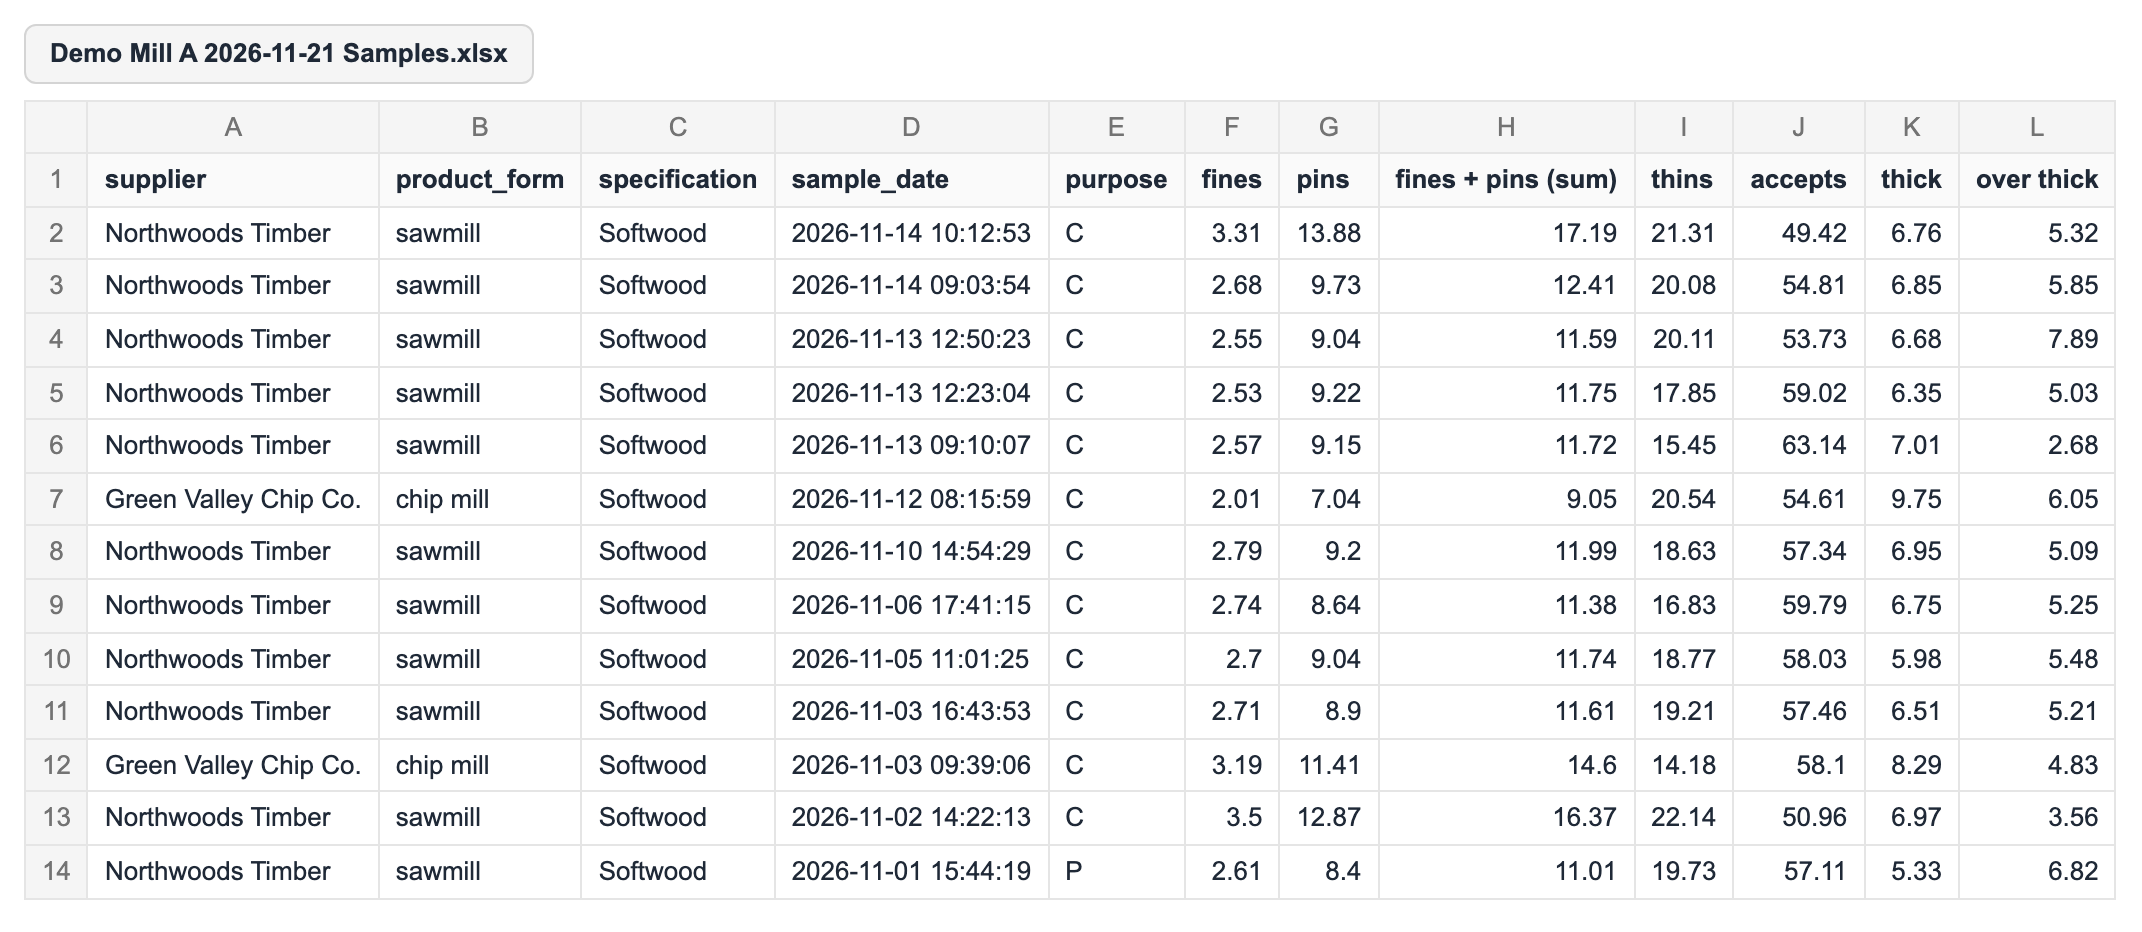
A data condition on combined fractions — fines and pins together, say — adds a (sum) column to the file. The samples download also follows the On hold condition, so you can pull the loads still waiting for review.
On Aggregate Sample Data, you pick the suppliers, specifications, year and period for the averages you download.
What is in a row
In the samples download, each row starts with the supplier, its product form, the specification, the sample date and the purpose. The measured values follow, with generated values such as recoverable fiber where your specifications calculate them, and the quality score and rating, along with the sample's own details, such as its test ID where it has one. An averages file includes the number of samples behind each row.
Benchmark suppliers before you download
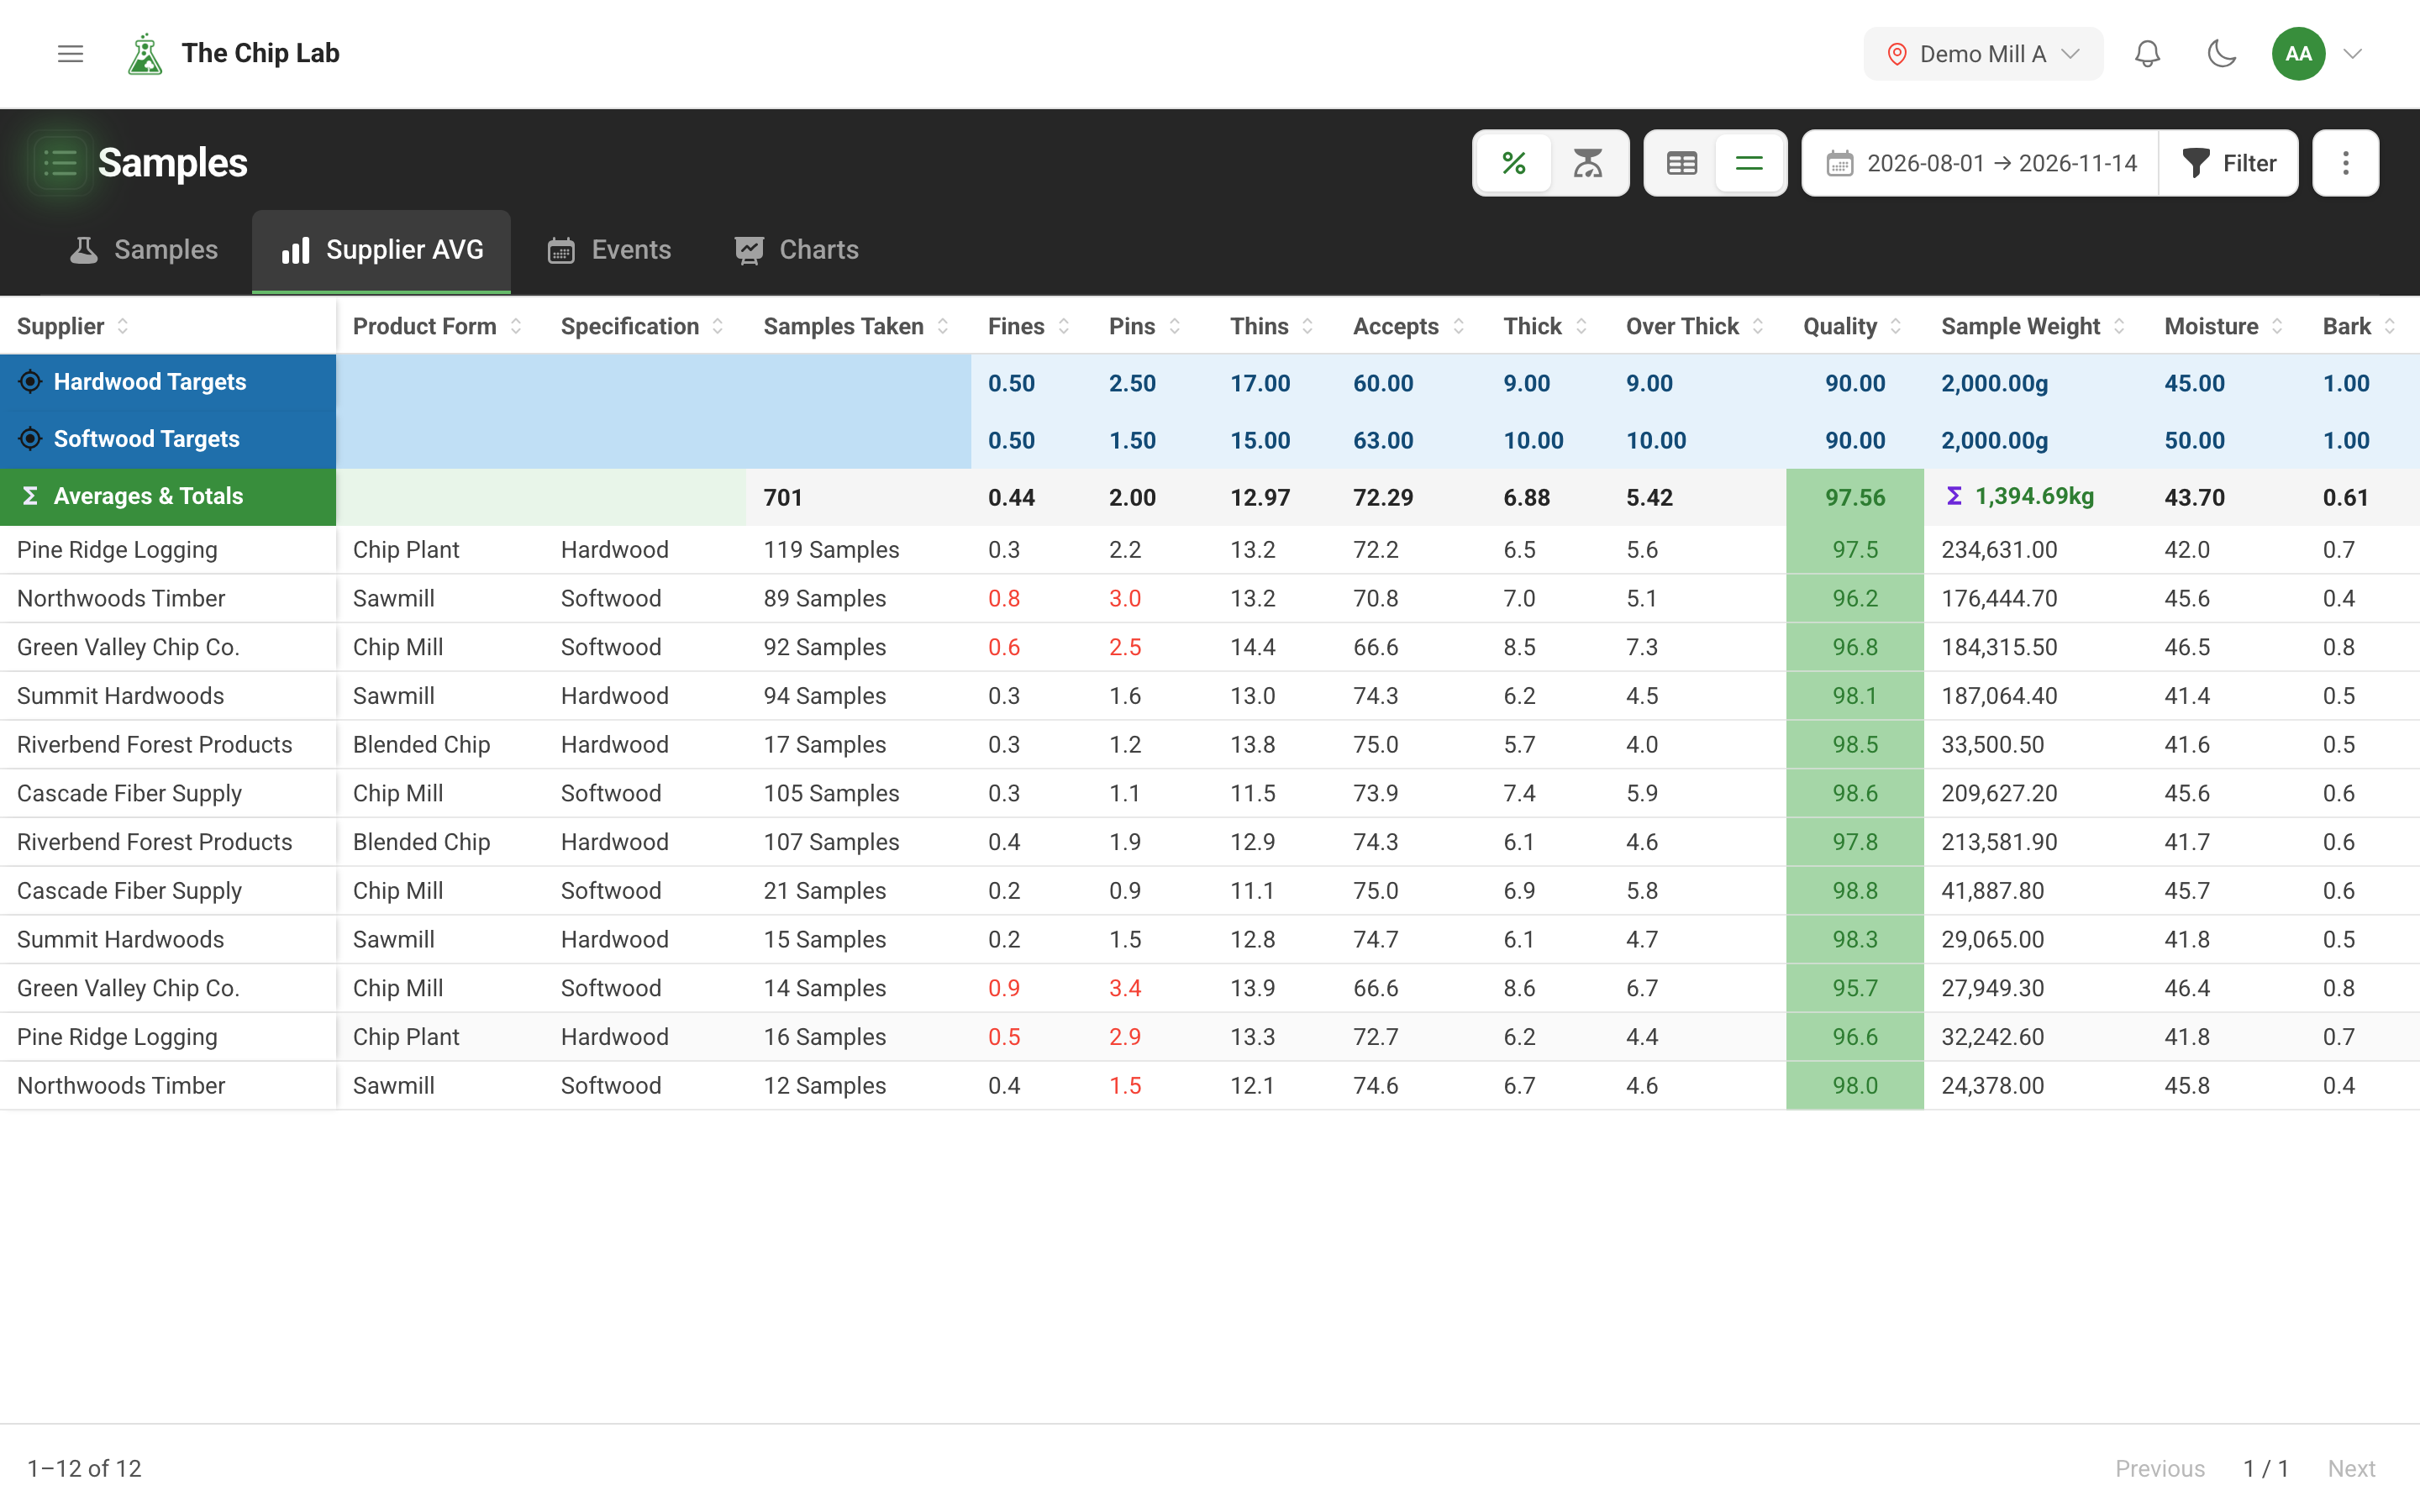
The Supplier AVG tab beside Samples shows the supplier averages on screen first. Press Load supplier averages and each supplier's averages for the current filter line up under your specification targets, with Samples Taken beside them and an Averages & Totals row across the whole set. Values outside the specification are red and the quality column is colored by rating, so the suppliers that need a conversation stand out before anything leaves the system. Where delivery data is available to you, Tons Delivered and % of Deliveries are added to each supplier.
Who can use it
Everyone who can see your mill's samples can download them, and a download holds only samples that person is allowed to see. Someone with Contributor access enters samples rather than reading them, and does not have these pages.
Downloads are made by the person who wants them, from the screen. If you are looking for a direct, automated feed into another system, talk to The Chip Lab team about what fits your mill.
Read next
- Finding samples — filters, data conditions, the averages views and sample groups.
- Scheduled chip quality reports by email — reports built from your sample data, sent to suppliers and managers on a schedule.
- Supplier management