
Sample trends: read a supplier's samples over time
An average says how a supplier is doing. It does not say whether the supplier is getting better or worse, or whether one bad load is behind the number. Each of those calls for a different conversation.
The Chip Lab keeps the samples behind a supplier's average one click away, on a chart against your specification.
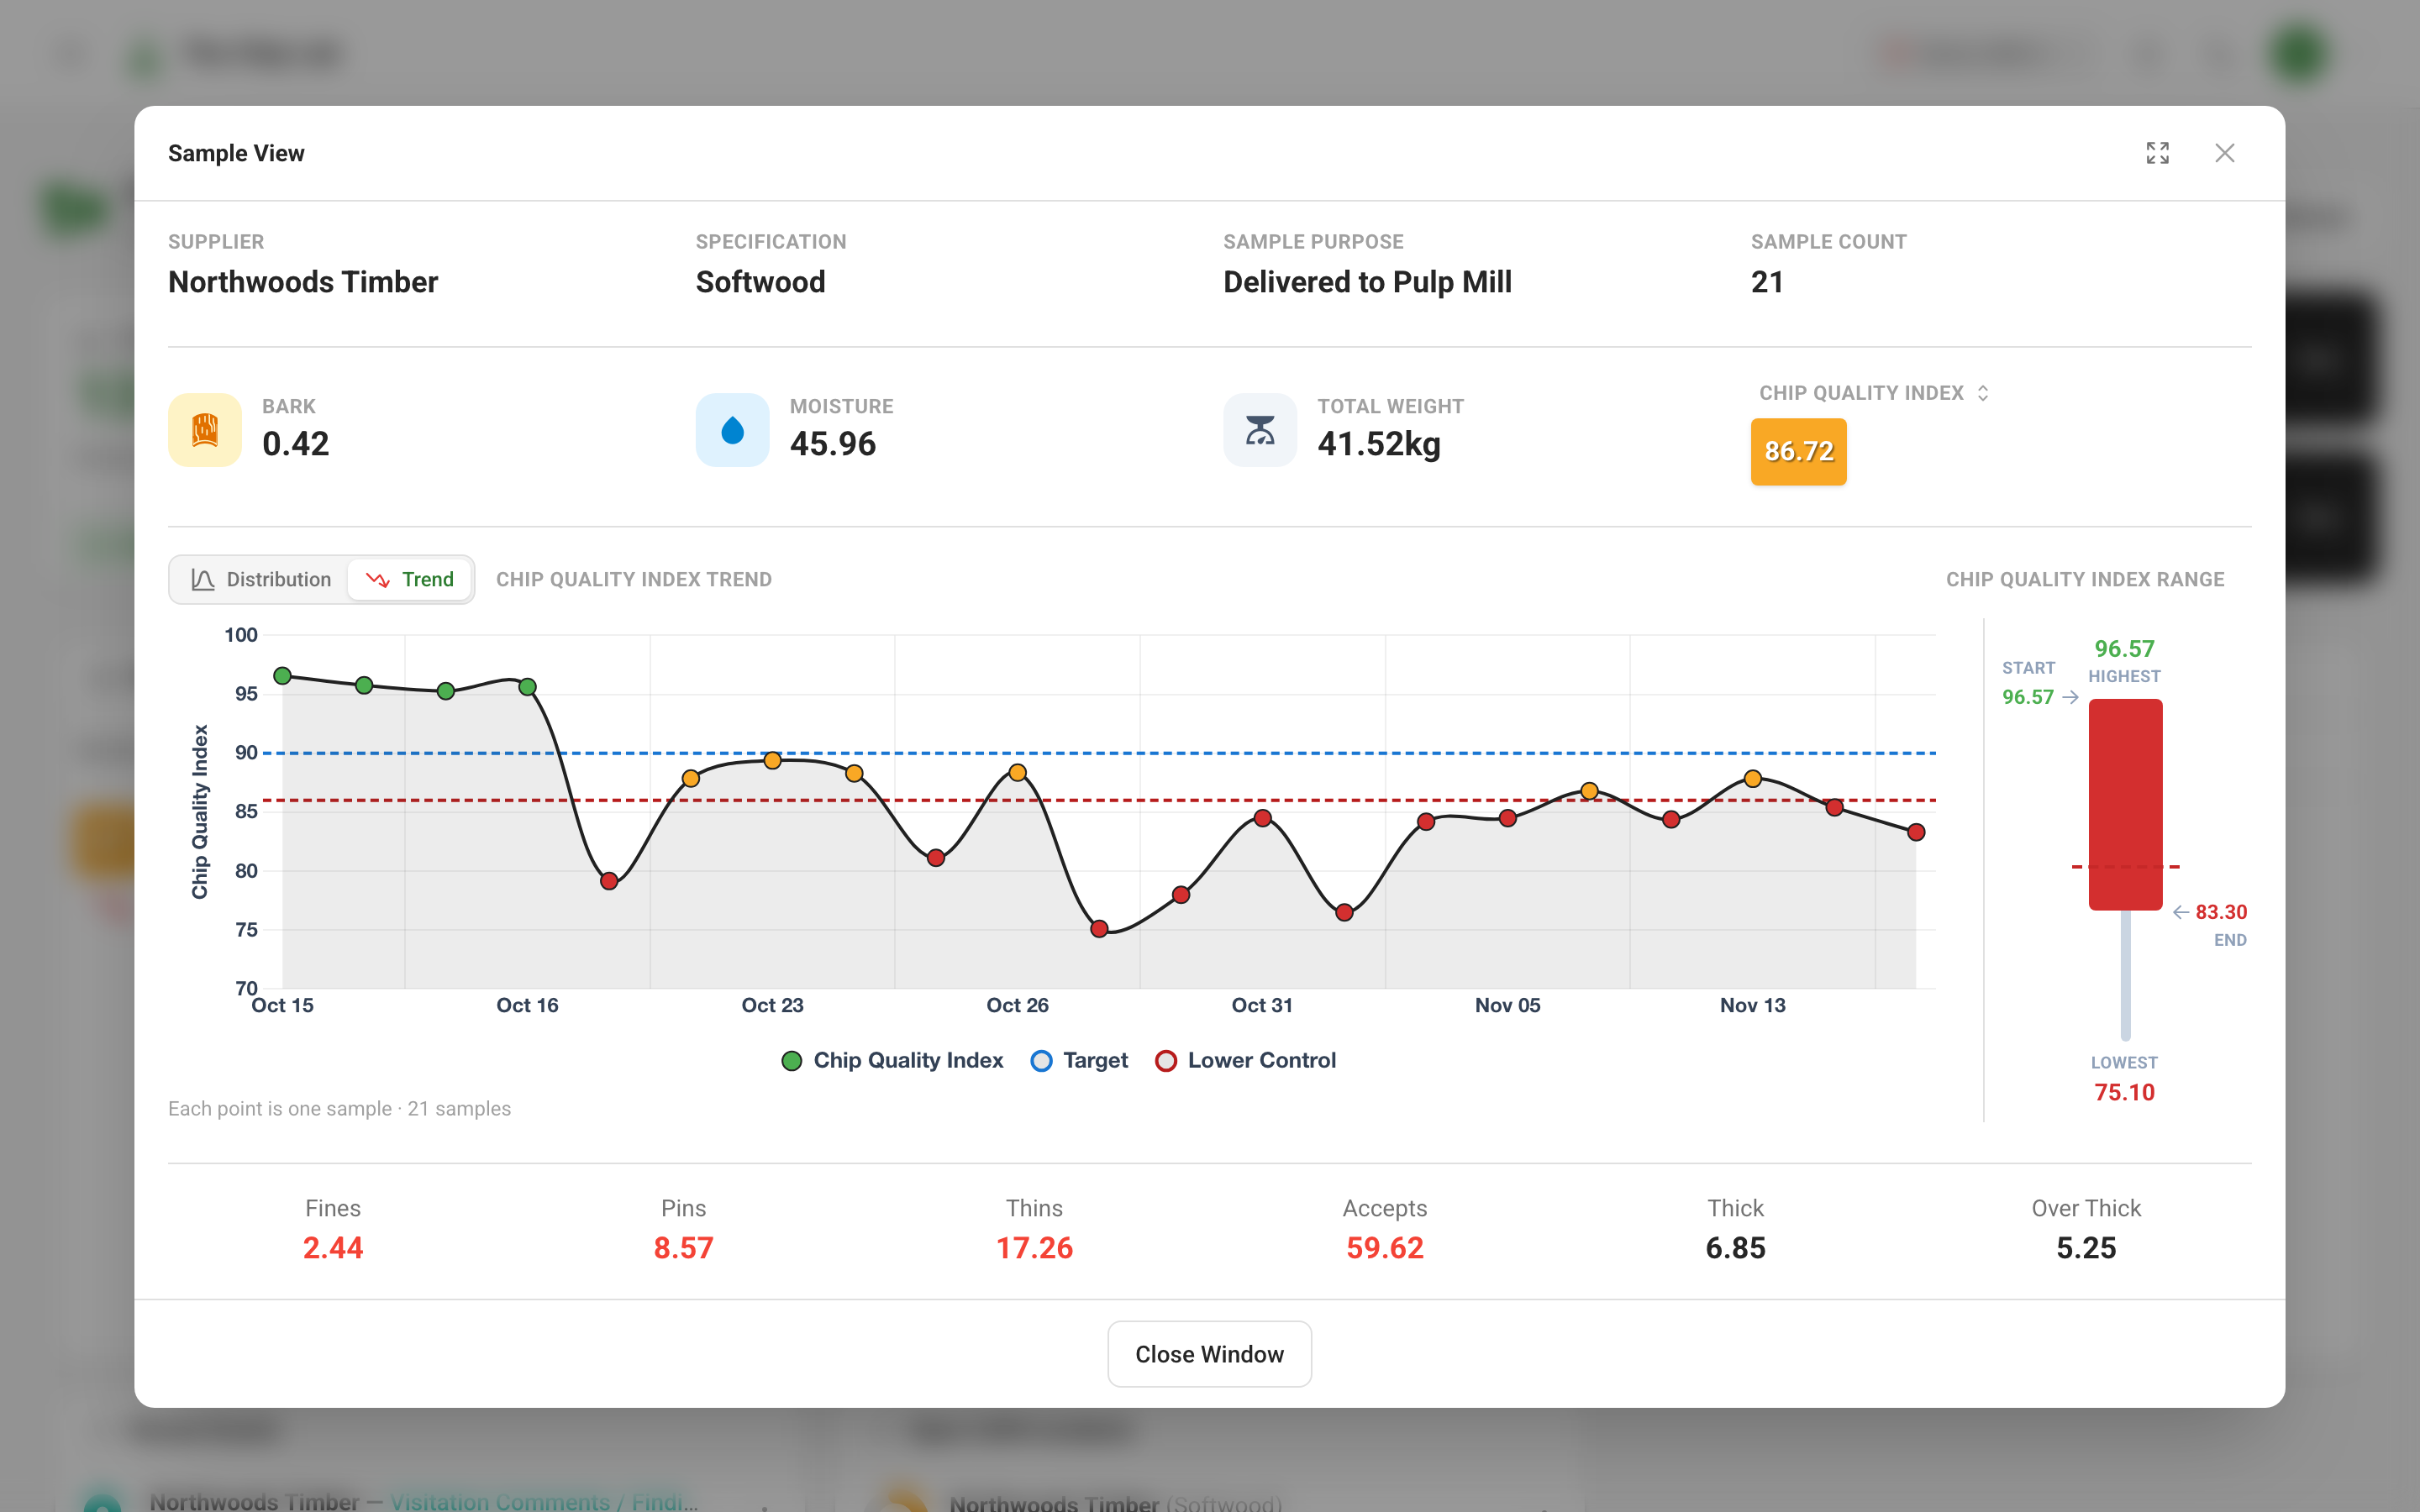
The Sample View window
On the dashboard's Priority Supplier tile, choose View Sample from the menu on a supplier's row; on Quality Alerts, choose the supplier's name. The Sample View window opens on that supplier's average.
The top of the window names the Supplier, Specification, Sample Purpose and Sample Count, followed by a few key readings and a colored badge for the measurement the window is about. The badge's label is a picker: choosing another measurement changes what the badge, the range and the Trend chart show.
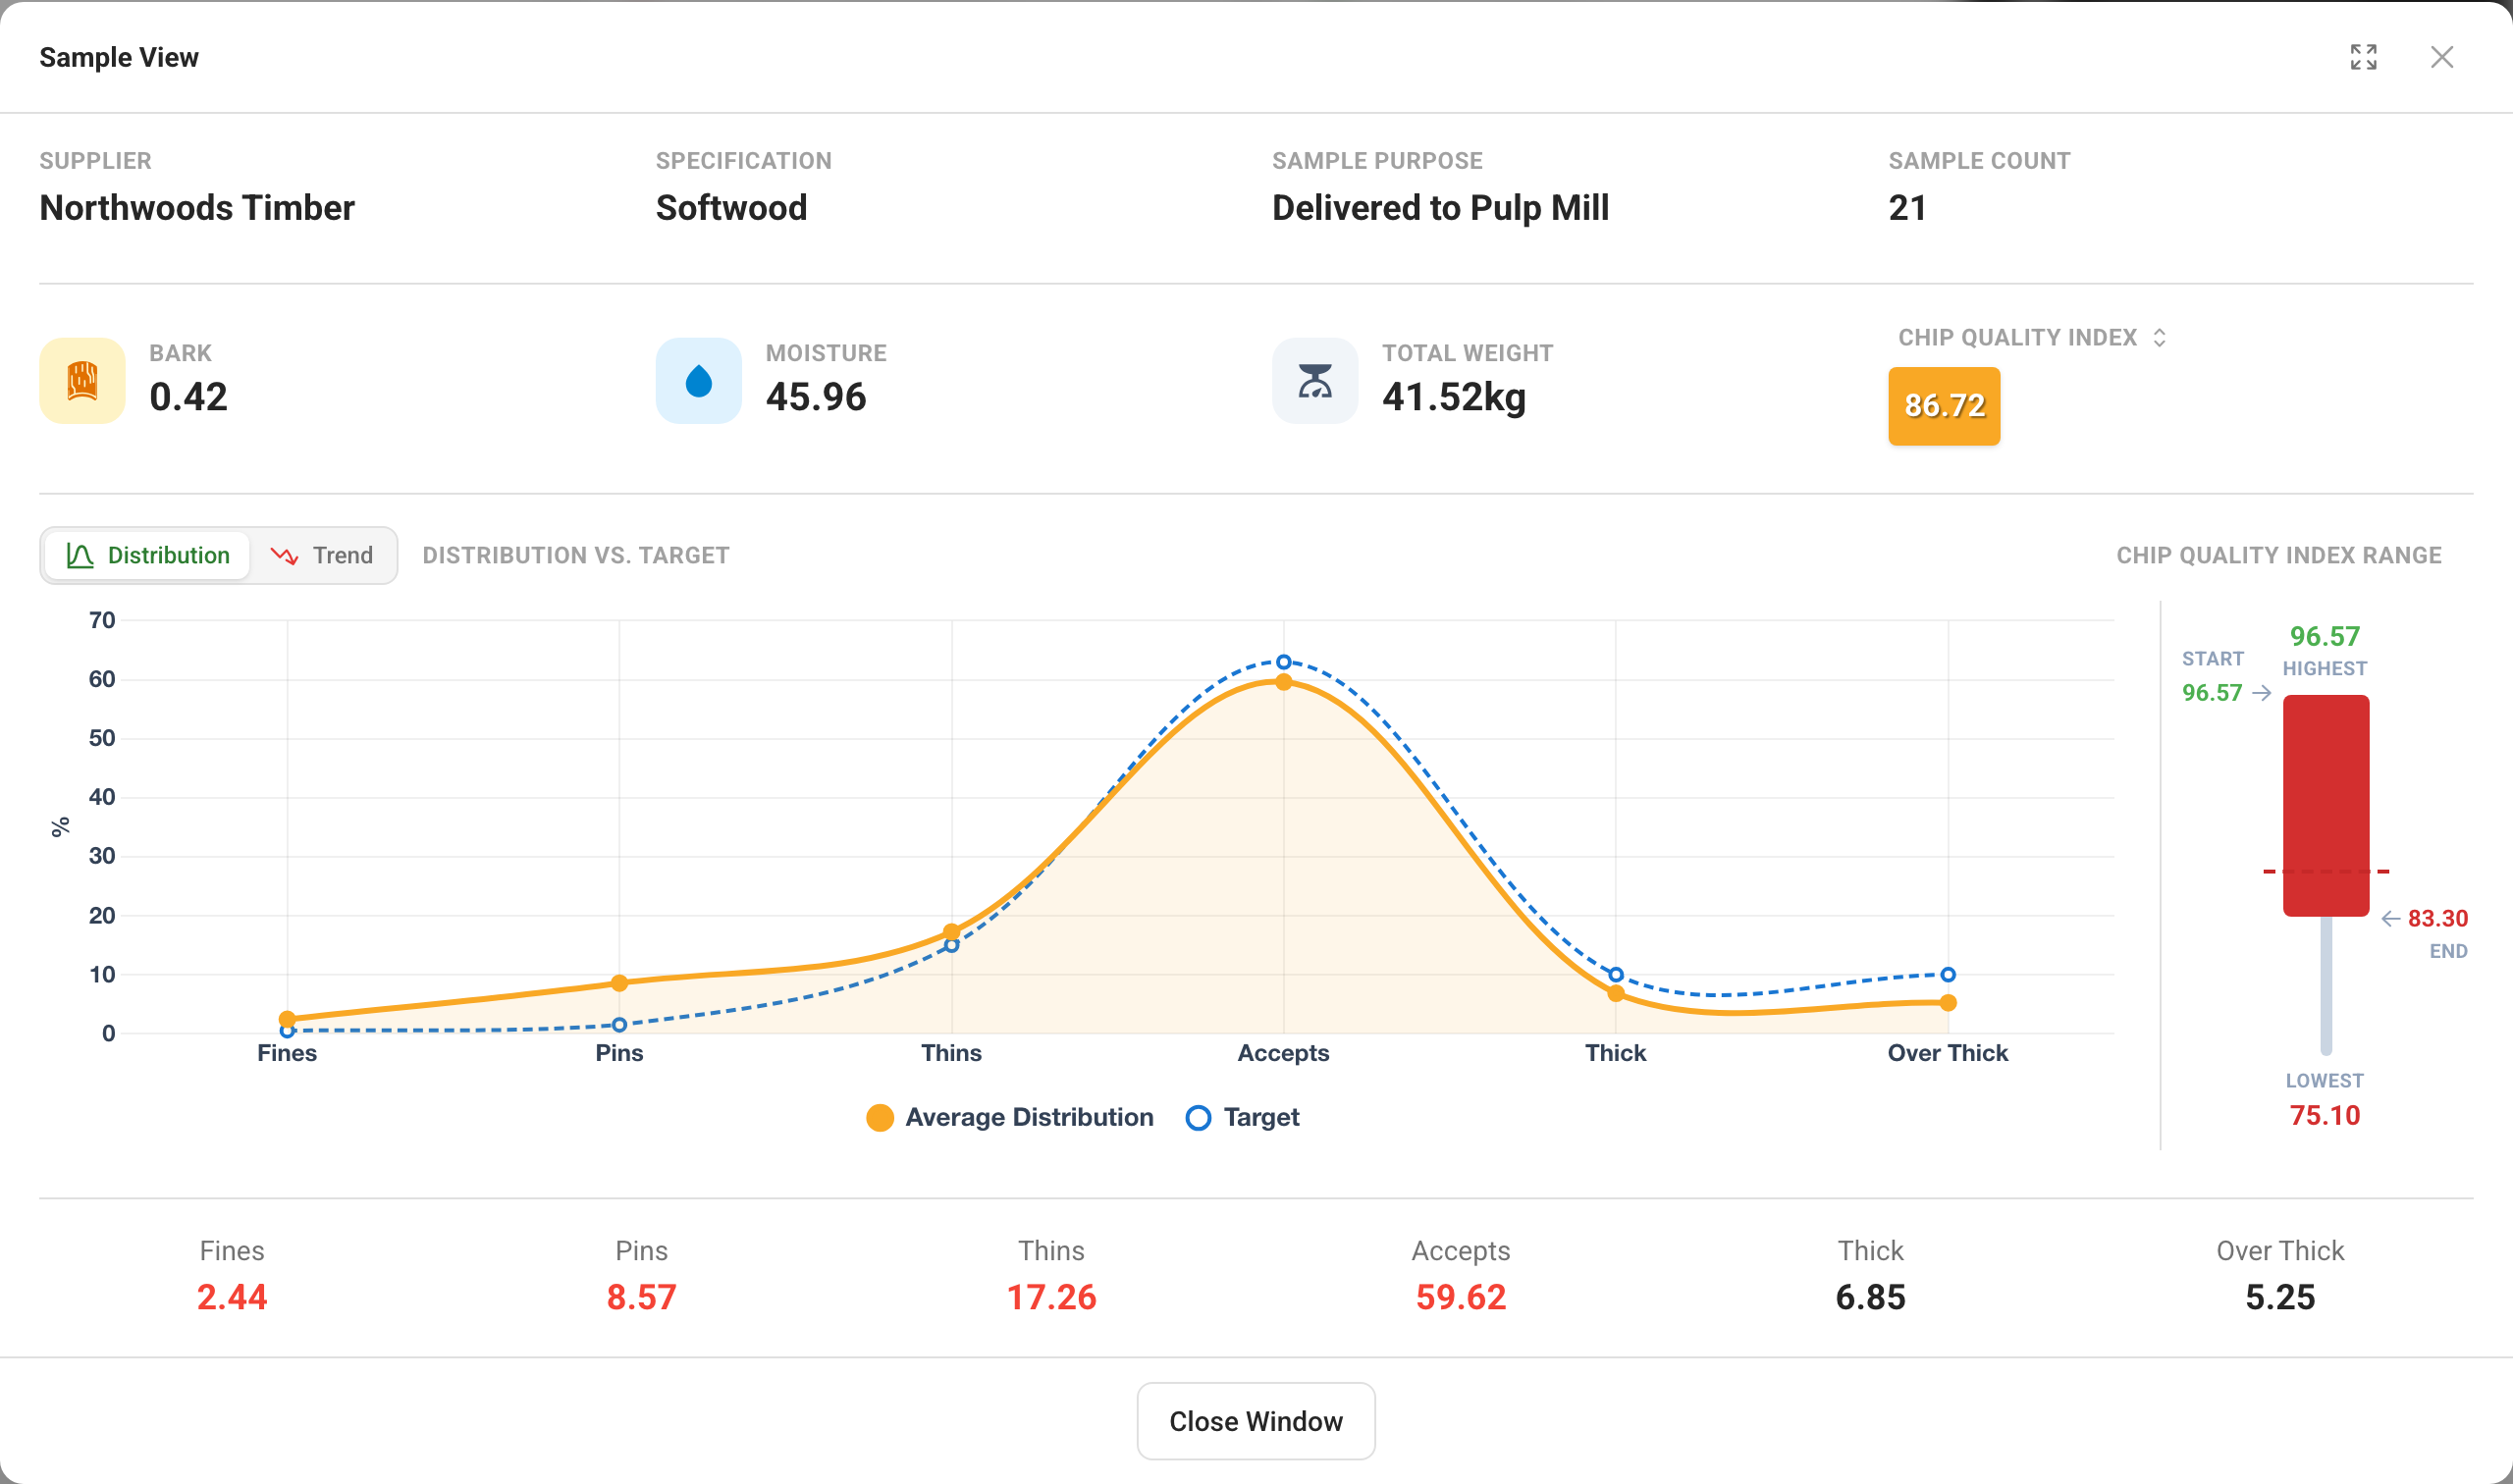
When the supplier has more than one sample in the window, the window offers Distribution and Trend, and a range panel beside the chart shows the highest, lowest, first and last readings; compare Highest and Lowest to see how much the readings vary. Distribution draws the average screen distribution against the specification's target, with each fraction's value underneath.
Trend: the supplier's samples in time order
Trend plots the supplier's sample readings in time order, one point per sample. Each point is colored by its rating, and dashed lines mark your configured target and control limit. The note under the chart says how many samples are plotted. The full-screen button gives the window the whole screen when you want to walk through it with a supplier.
Supplier rows on the Priority Supplier tile and on Quality Alerts carry a trend arrow. It points up when quality is rising over the window and down when it is falling, so you know which suppliers to open first.
Charts for a whole period
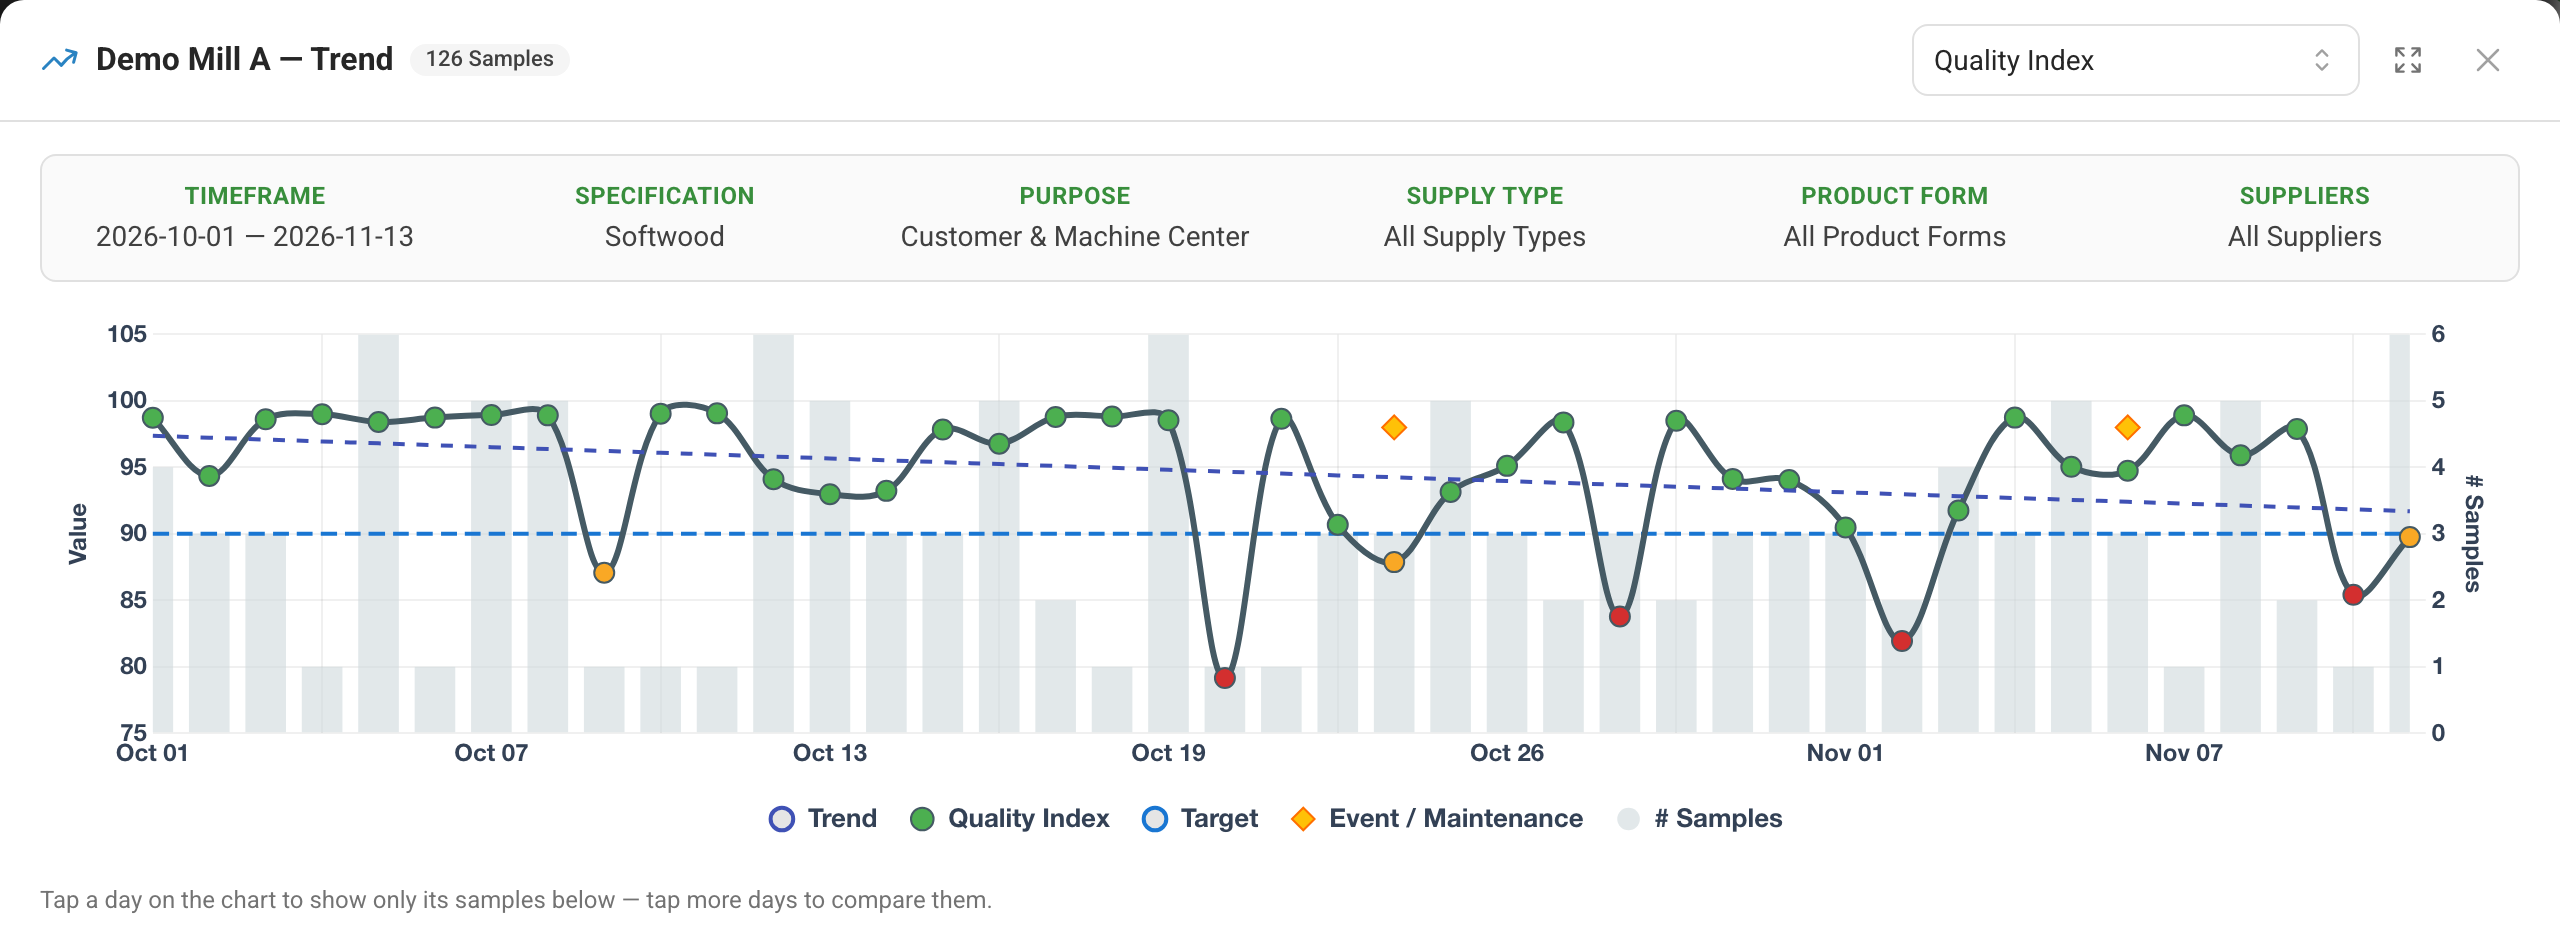
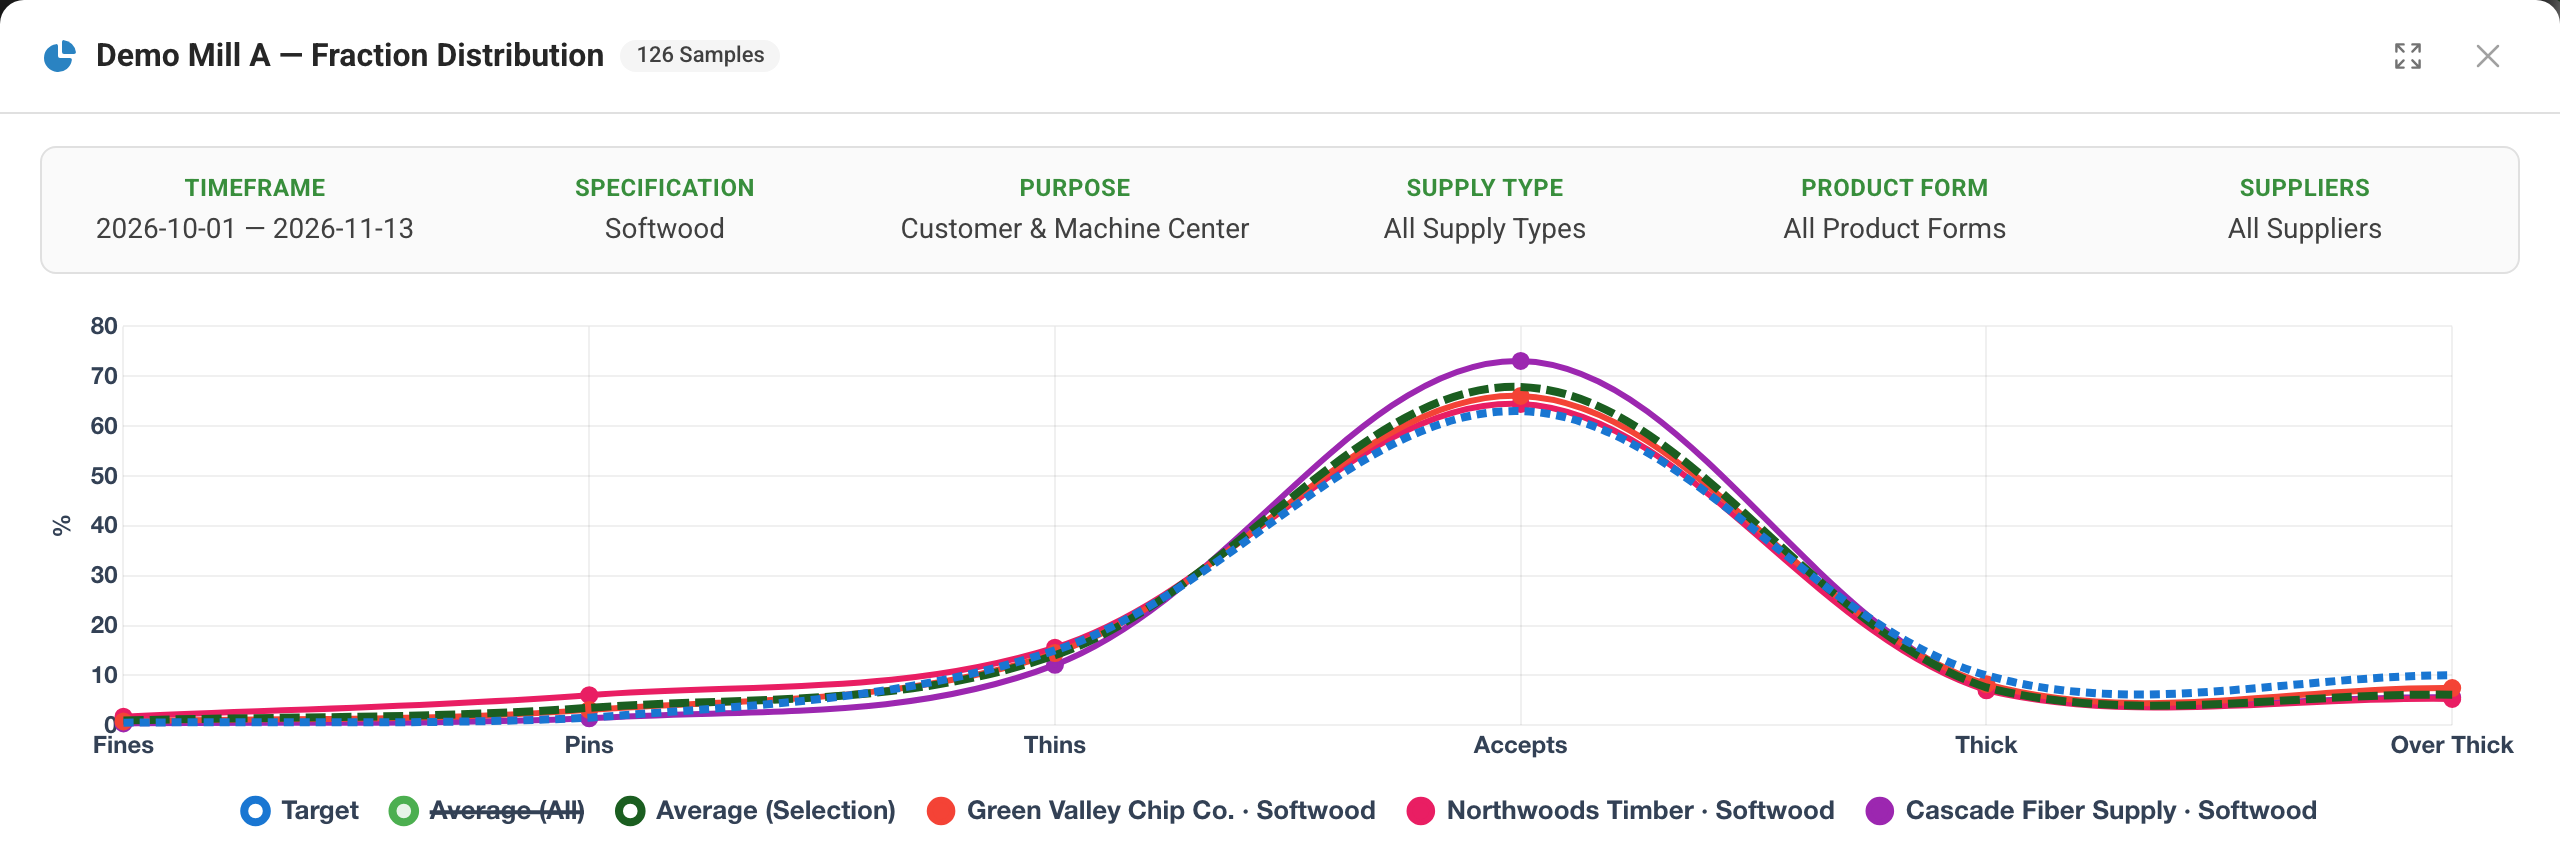
On the Samples page, the Charts tab includes two full-screen charts of the samples you have filtered. Both repeat your filters across the top, so a shared chart carries its own context.
Trend follows one measurement over the period, with daily averages as points and sample counts as bars; a straight trend line and the target are drawn over them. Choosing a day with samples filters the grid below the chart to that day, and an event marker opens that day's events.
Fraction Distribution compares screen distributions, with a table of supplier averages below. The chart draws a line for each row you tick and the target, and can show an average of your selection; where delivery data is available to you, that average can be weighted by tons delivered.
Insights next to the numbers
The Priority Supplier tile and Quality Alerts also show Insights: labels that flag specific out-of-specification readings on the supplier's average. Click one to read what it means, with Recommended Actions where there are any.
Who can use it
Everyone who can see your mill's samples can open the Sample View window and use the Charts tab.
Read next
- Dashboards — the tiles these windows open from.
- Quality Overview and Quality Alerts — supplier rankings and the alerts list.
- Finding samples — the filters that decide what the charts show.
- Process behavior charts — is a change real, or ordinary variation?