
Process behavior charts: real shift or ordinary variation?
One of a supplier's results is up this month. Is that the start of a problem — a worn knife, a new crew, a different wood mix — or just the kind of wobble their chips always have? Call the supplier every time a number moves and you wear out the relationship; wait too long and you are paying for it in the digester.
The Process Behavior Model answers that question from the supplier's own history.
The idea, briefly
Every supplier's numbers vary from month to month. A process behavior chart (sometimes called an XmR or individuals chart) works out, from the supplier's own history, how far that ordinary variation usually reaches — the natural process limits. A month inside the limits is routine; a month outside them, or a jump between months bigger than the history supports, is a signal that something has really changed and is worth a conversation.
Setting it up
Open Performance & Quality in the menu and choose Process Behavior Model. The Setup page asks for:
- a Start Year and End Year,
- a Specification,
- and either a Supplier, or a Supply type and/or Product form to look at a whole class of supply together.
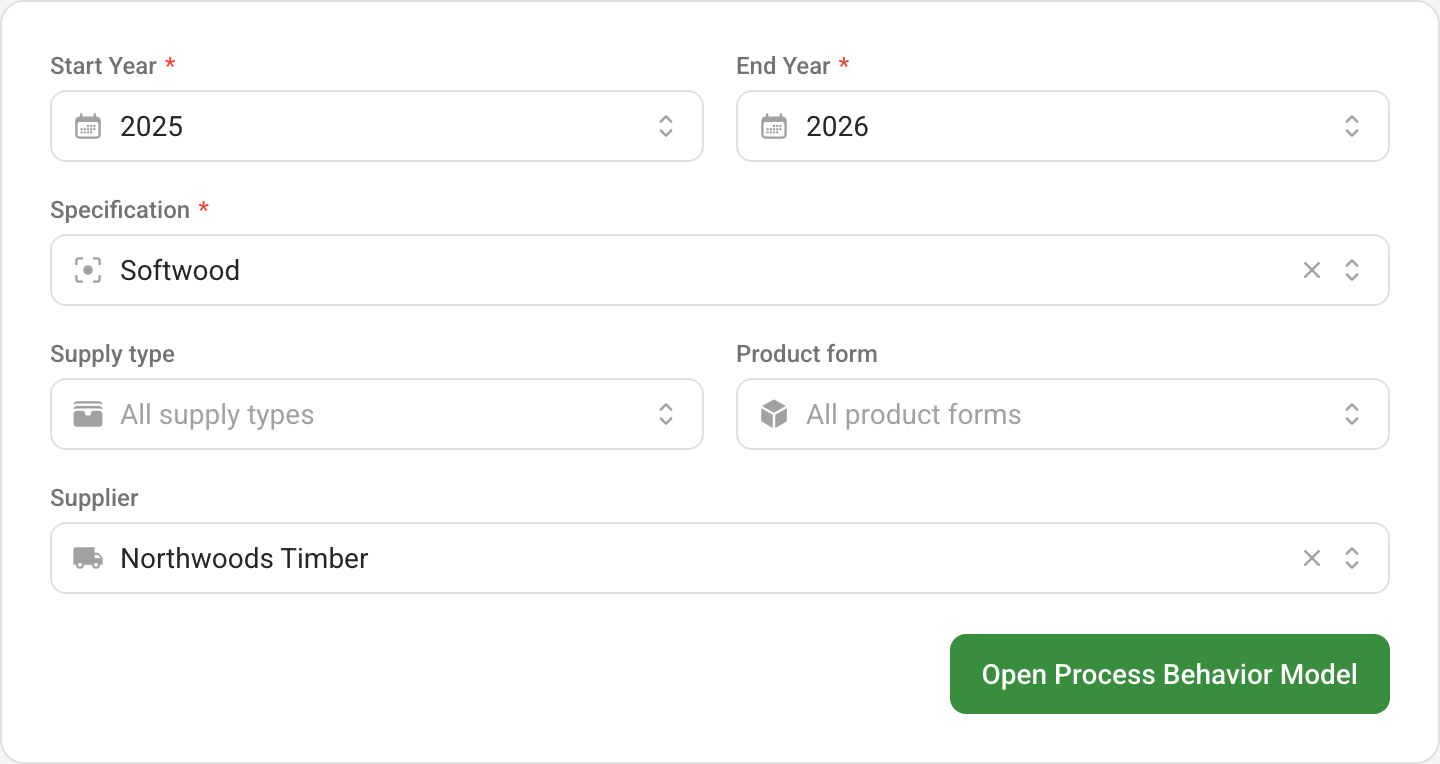
Open Process Behavior Model runs the model. The scope you chose stays across the top of the page, and Setup takes you back to change it.
Reading the model
The model works on monthly averages of the supplier's live samples. For each field you chart you get two charts, one above the other:
- the value chart, each month's result plotted against the process average and the upper and lower natural process limits;
- the moving range chart, how much each month differs from the one before, against its own upper limit.
Points inside the limits are routine variation. Points beyond them are marked as signals.
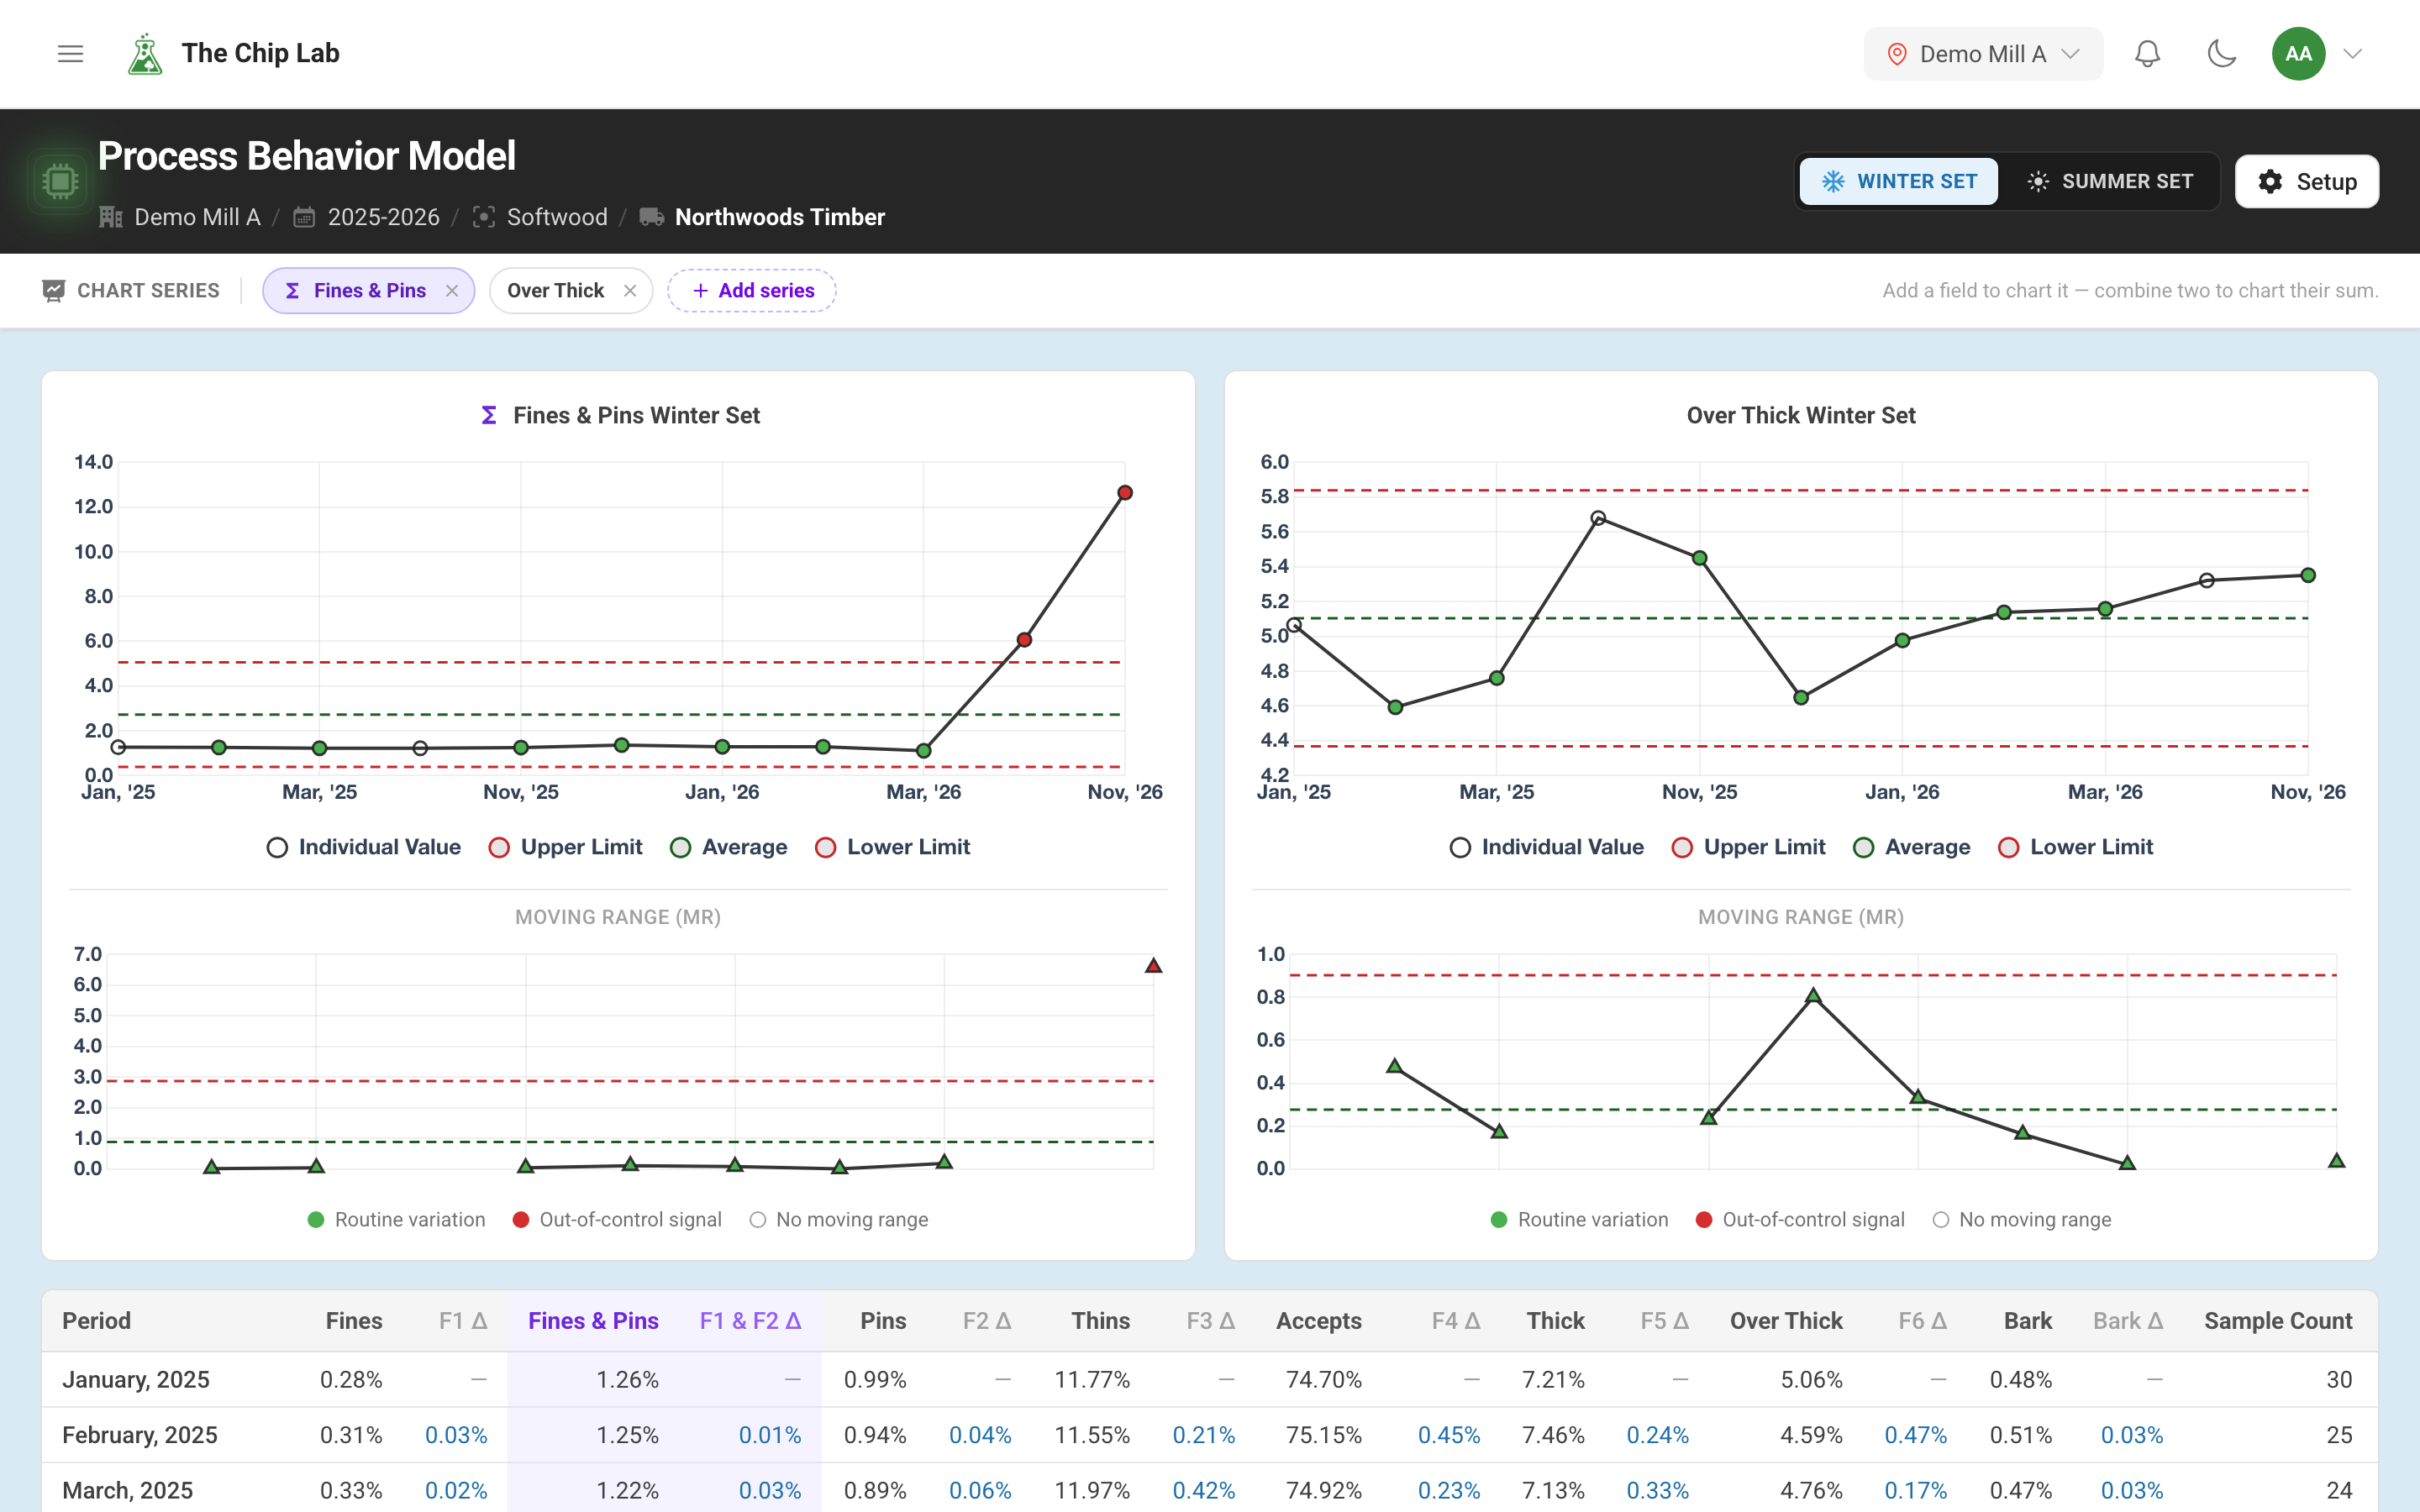
The picture above is what a real change looks like. For two winters this supplier's fines and pins, charted together, wobble a little from month to month and never come near a limit: that is the supplier's ordinary variation, and no month in it deserves a phone call. Then this autumn breaks out: October lands above the upper limit and November far above it, and the jump from October to November is far bigger than any month-to-month change in the history. Over-thick, beside it, stays inside its limits for every month, values and moving ranges alike. The chart does not say why — a dull knife, frozen wood, a new crew — but it does say the question is worth asking now.
Chart Series along the top chooses which fields are charted. Add any field your specification measures, or the quality score itself, or pick two or more together to chart their sum.
Winter and summer
Wood, weather and yard conditions change through the year, and a supplier's chips change with them. Mixing a frozen January with a dry July widens the limits until nothing ever looks unusual. So the model splits the months into two sets and works out limits for each separately: the Winter Set (October to March) and the Summer Set (April to September). Switch between them at the top of the page.
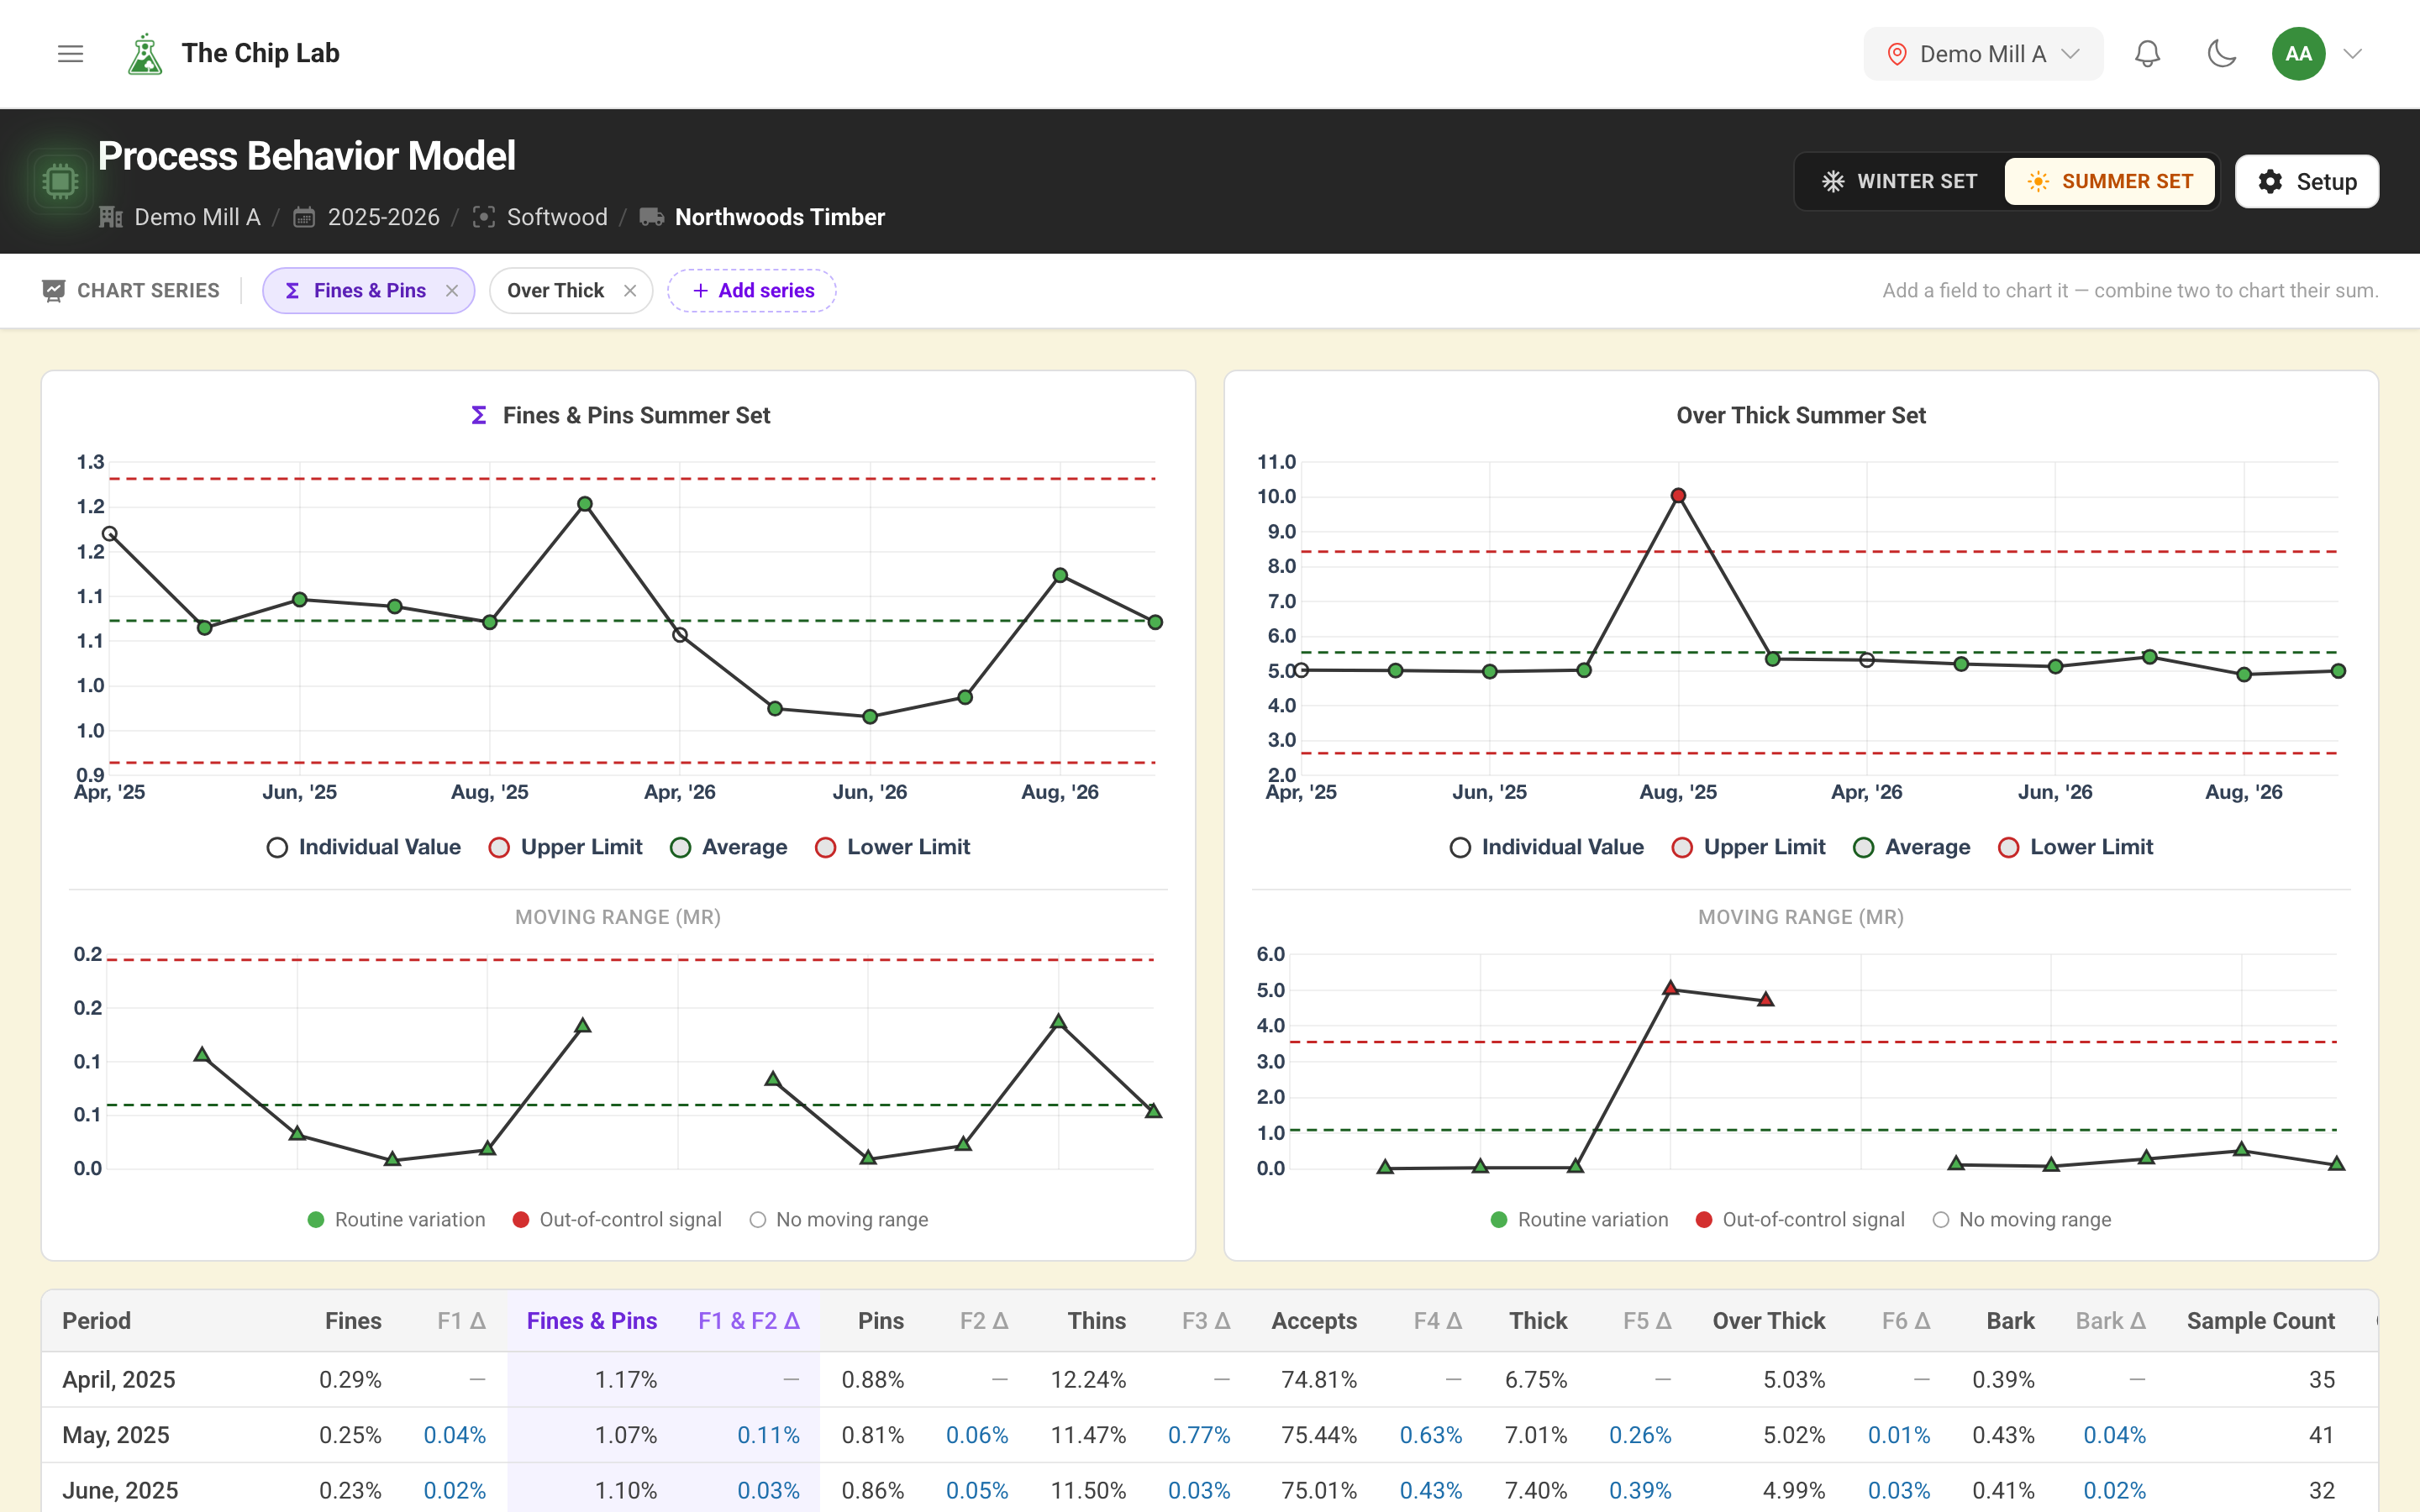
The summer set tells a different story about the same supplier: in one August over-thick chips jumped above the upper limit and came straight back inside it the month after. The moving-range chart marks both the jump up and the jump back down; every other summer month, and fines and pins throughout, stays inside the limits — a single episode in an otherwise steady record, and the month to ask the supplier what changed, and what they changed back.
The monthly table
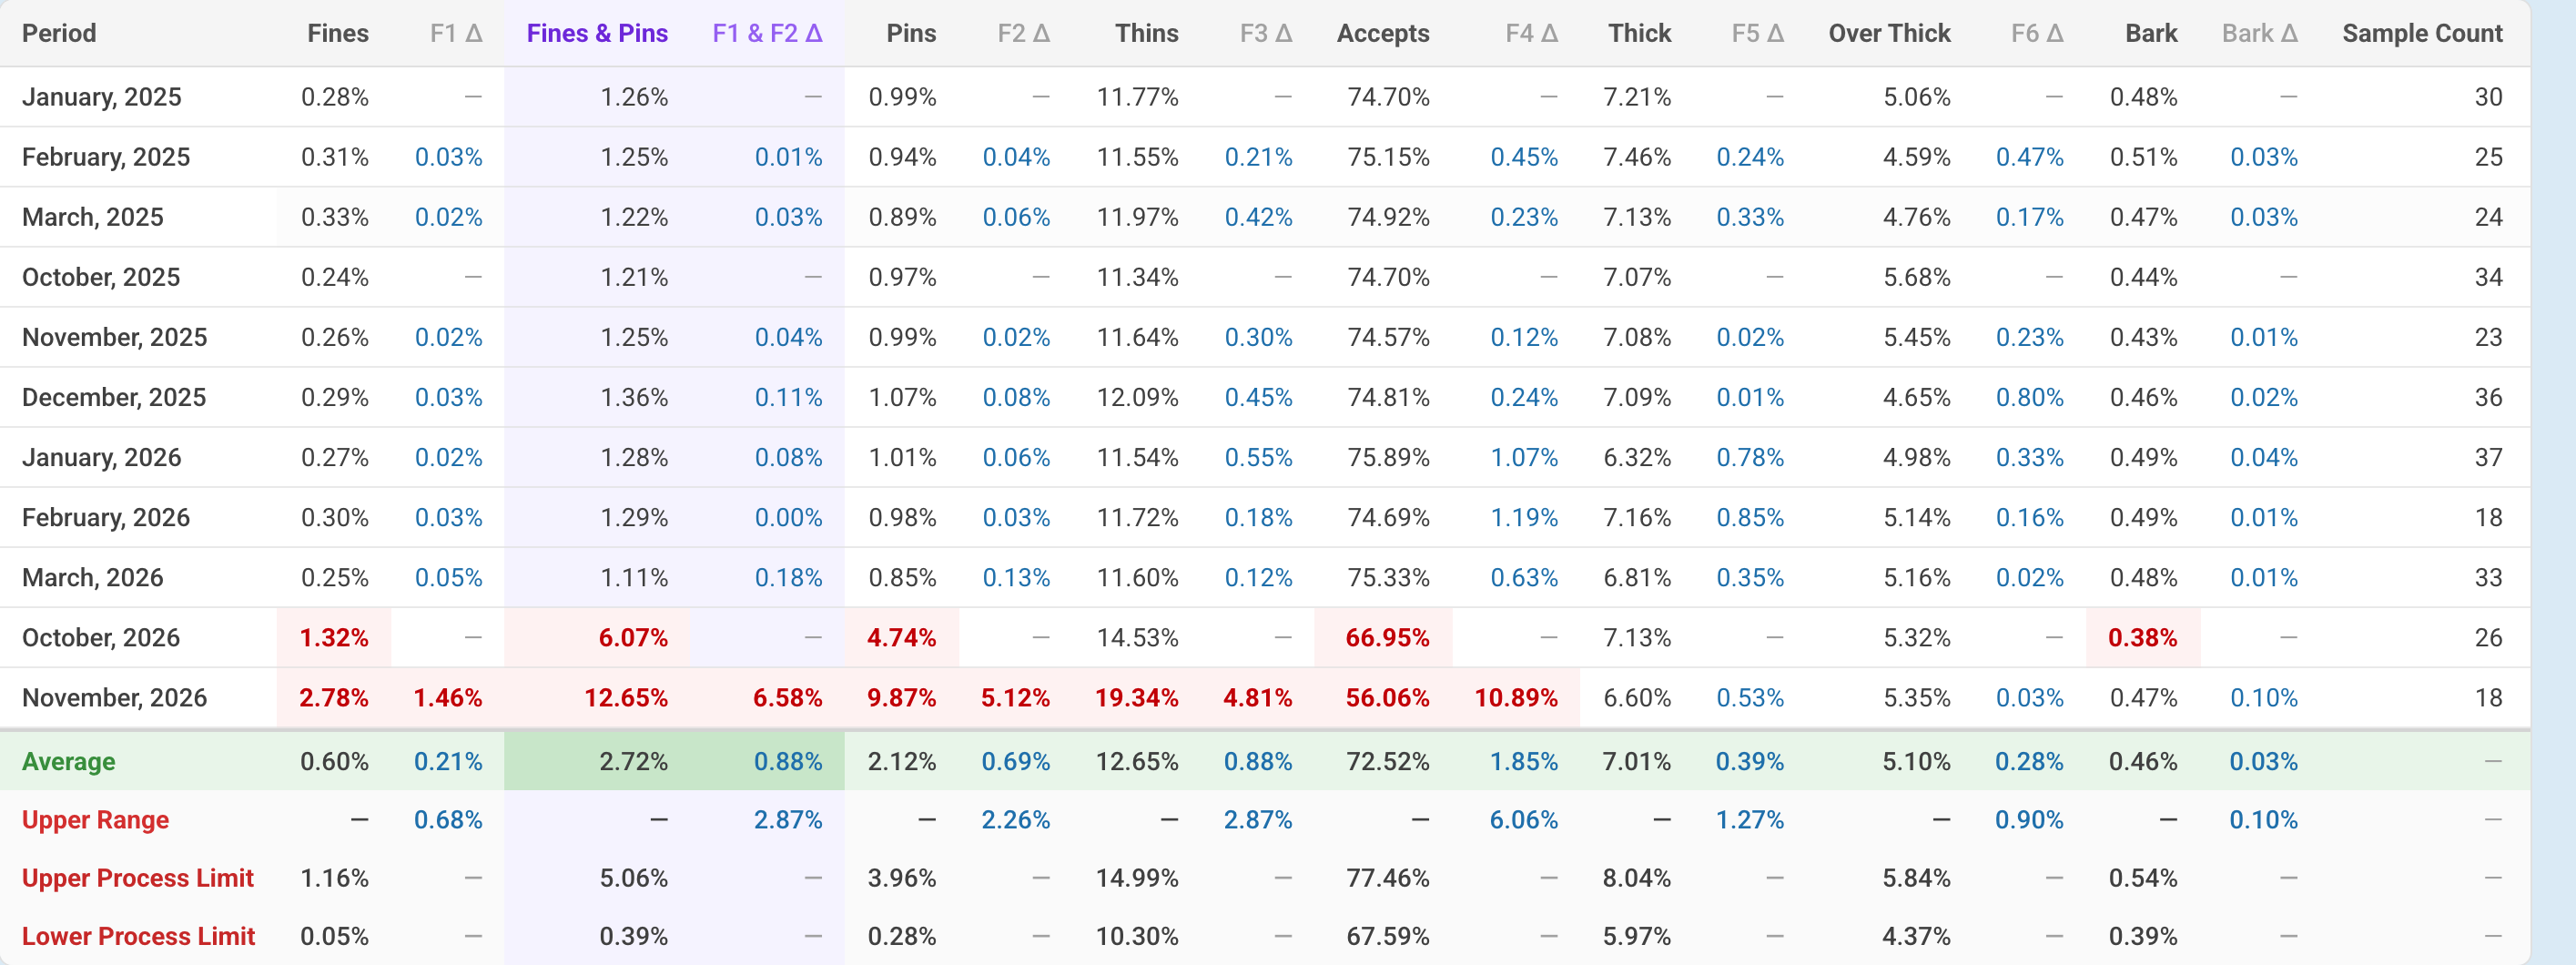
Below the charts, a table lists every month in the set with its value and its change from the month before, field by field. The last four rows sum it up: the Average, the Upper Range limit for month-to-month change, and the Upper Process Limit and Lower Process Limit. That gives you the numbers behind the charts when you need to quote them to a supplier.
Who can use it
The Process Behavior Model needs the Chip Data permission at Manager or above.
Read next
- Corrective and preventive action (CAPA): when a supplier's quality does drop, open, track and close the follow-up automatically.
- Sample trends — a supplier's samples one by one over time.
- Quality overview and alerts