
Chip quality reports: what each report shows
A chipper superintendent, a fiber procurement manager and a mill manager all need to hear about chip quality, but not the same story. The supplier wants to know how their own loads measured up and what to fix. The manager wants the suppliers side by side. The person running the woodyard wants to know which way things are heading before the month is out.
The Chip Lab builds each of those reports from the samples your mill has already recorded, judges them against your specification targets, and sends the result as a PDF. This article walks through what is in each report. How reports are scheduled, triggered and addressed is covered in Scheduled chip quality reports by email.
How the reports read
Each report opens with a header naming the report, its date and, where it applies, the specification and supplier. As configured, a table can carry a green Target row above the results, so each number sits under the value it is judged against. Measurements outside the specification are shown in red, and quality scores are shaded by their rating. Charts can draw the target and a Lower Control line.
What a report contains is fixed by its configuration: which sections, which periods, which groups of suppliers. Configurations are set up with The Chip Lab team, so your reports can be shaped around how your mill buys and uses wood. The descriptions below follow a typical configuration.
Supplier report
For: each supplier, sent to that supplier's own contacts, with only their own samples.
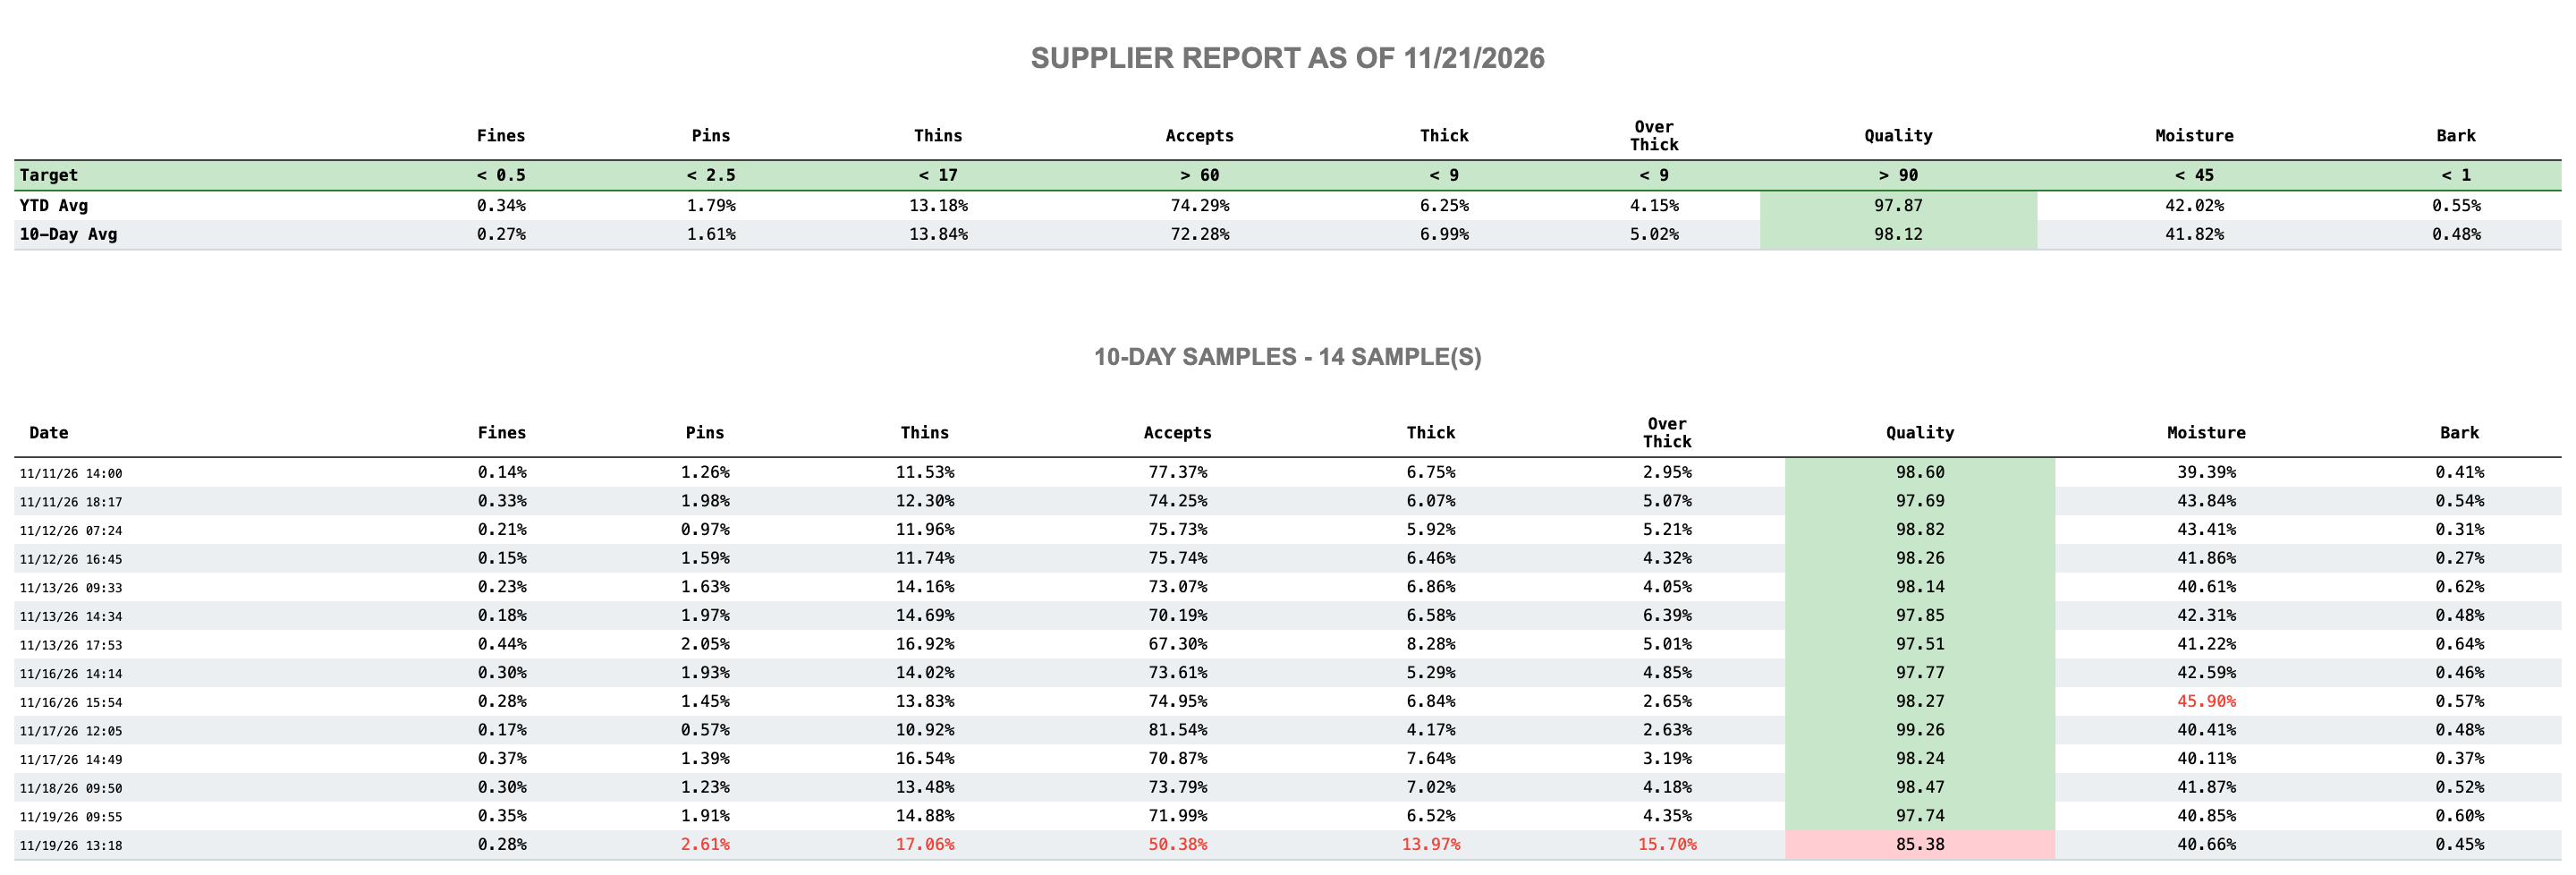
It opens with a cover letter from your mill and the supplier's Quality Rank among your suppliers for that specification. Next come the charts: a six-week quality trend with its trend line, target and lower control limit, a six-week bark trend, and a curve of the supplier's recent fraction distribution laid over your target. The last page holds the numbers: the year-to-date and recent averages against target, then the supplier's samples from the recent period, one row each.
Manager report
For: the mill's own managers.
The manager report puts the mill's whole supply for a specification in one place. Charts show quality, the fraction distribution and bark across the mill's supply groups, such as digester, chip mill and purchased chips. Its tables show the groups and the suppliers, each with its sample count, over a recent window, then the suppliers again over a longer one, so a supplier's bad week can be read against their last six weeks.

Trend report
For: the people who manage the woodyard and the fiber supply day to day.
The trend report answers which way is it going. Its first page is a short summary per source of chips: the 30-day average of the charted measurement, the target and how many samples it rests on. Where a trend can be worked out, the report labels the 30-day trend Up, Down or Flat. Charts for each source follow, then a table of the 30-day averages against target. A trend report can cover several specifications at once, grouping sources the way your mill thinks about them, such as purchased sawmill chips and purchased roundwood chips.

Sample report
For: whoever needs to hear about one sample, often the moment it is recorded.
A sample report is about a single sample. The header lists the test date, supplier, specification, the quality with its rating, the sample and residual weights, the operator, the data source and the test ID. Below it are the sample's fraction distribution drawn over your target, and the sample's results in one row against the target. Sent by a trigger when a sample is recorded, it lets a supplier or a shift lead see an out-of-spec load the same day. In View & Send you open one by entering its Sample ID.
Weighted quality report
For: procurement and mill management looking at the year.
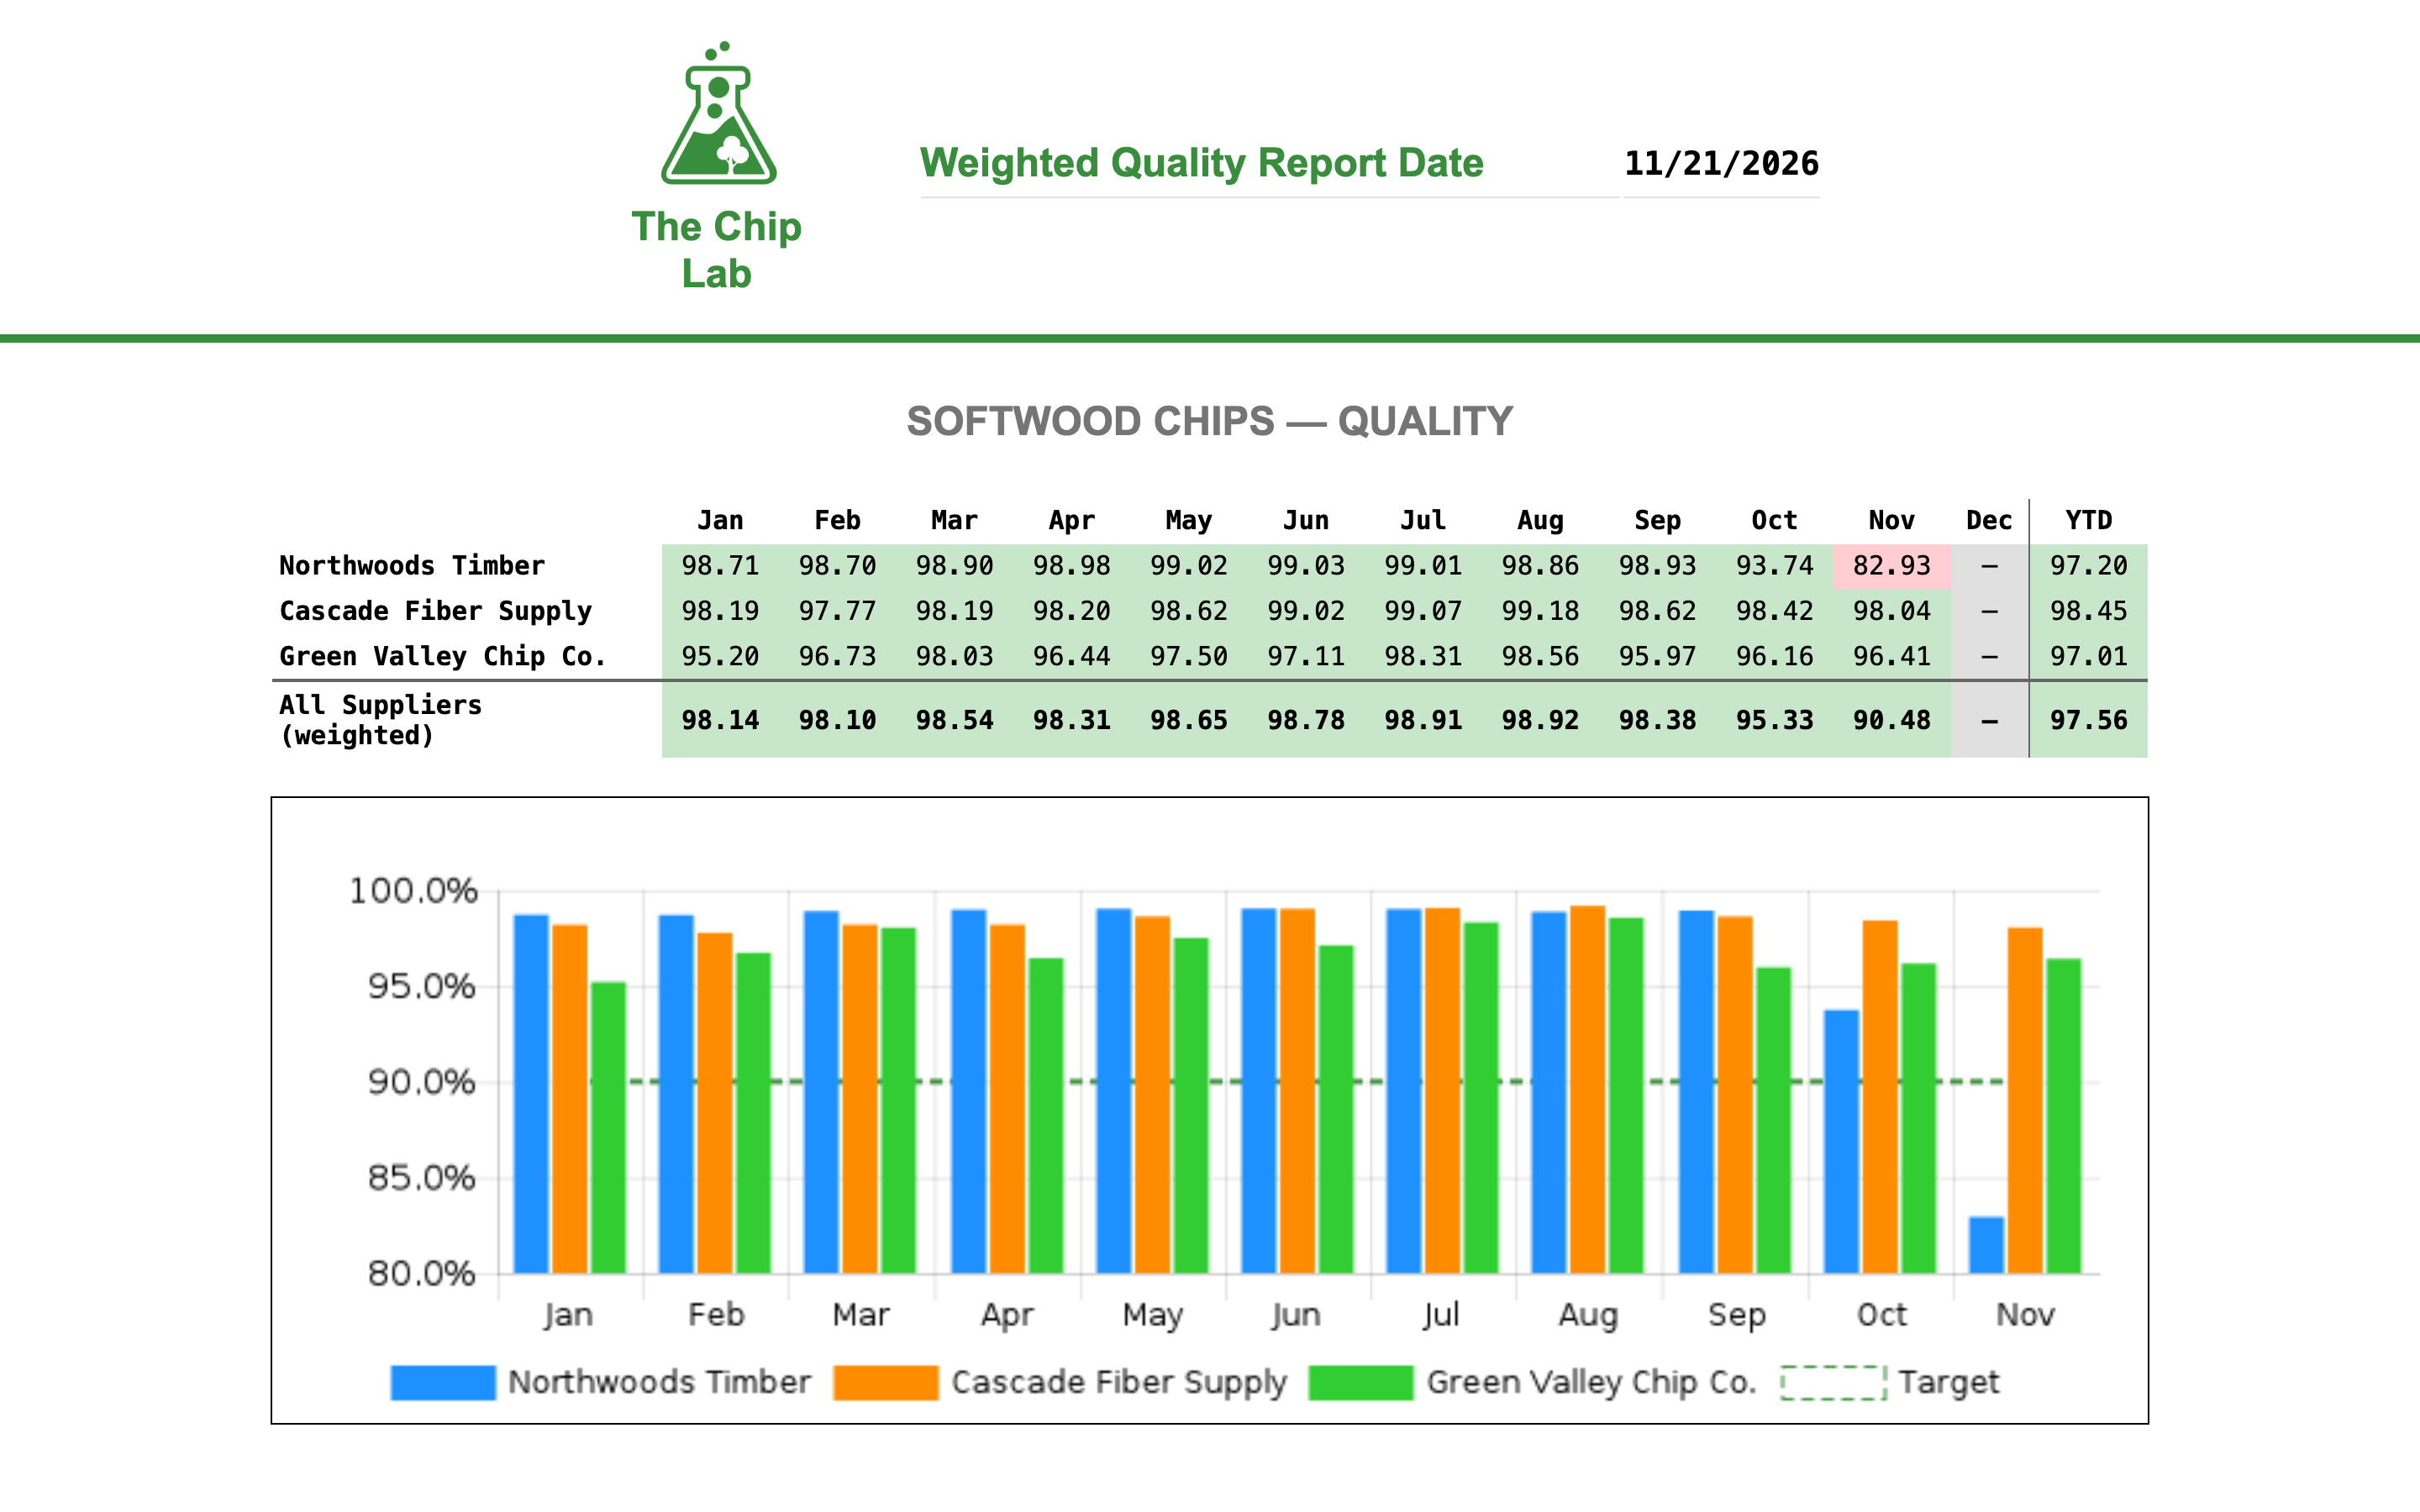
The weighted quality report lays out the year month by month. For each specification it shows quality and bark for the suppliers it covers, one column per month plus YTD, with a bar chart of the suppliers against the target. The bottom row, All Suppliers (weighted), weights the suppliers by the tons delivered, where your mill has delivery records for them, so a supplier who sends most of your wood counts for more than one who sends a few loads.
Who can open them
Reports are viewed and sent from Reporting, under Management in the sidebar: an Admin or Owner account with the Reports permission at Manager or above. On its View & Send tab, each report row has Preview Report (HTML) and Preview E-Mail (HTML), so you can read a report and the email that carries it on screen before anyone receives it. Recipients do not need an account: the report arrives as a PDF.