
Supplier chip quality against target: overview and alerts
A fiber-supply meeting needs two things: the whole picture, where every supplier stood against spec over the month, and the short list of who needs a phone call today. Pulling either one out of a lab spreadsheet means filtering, pivoting and coloring cells by hand, and the work is repeated every time someone asks.
The Chip Lab gives you both under Performance & Quality in the sidebar: the Quality Overview Report for the whole picture and Quality Alerts for the short list. Anyone at your mill with access to chip data can open them.
Quality Overview Report
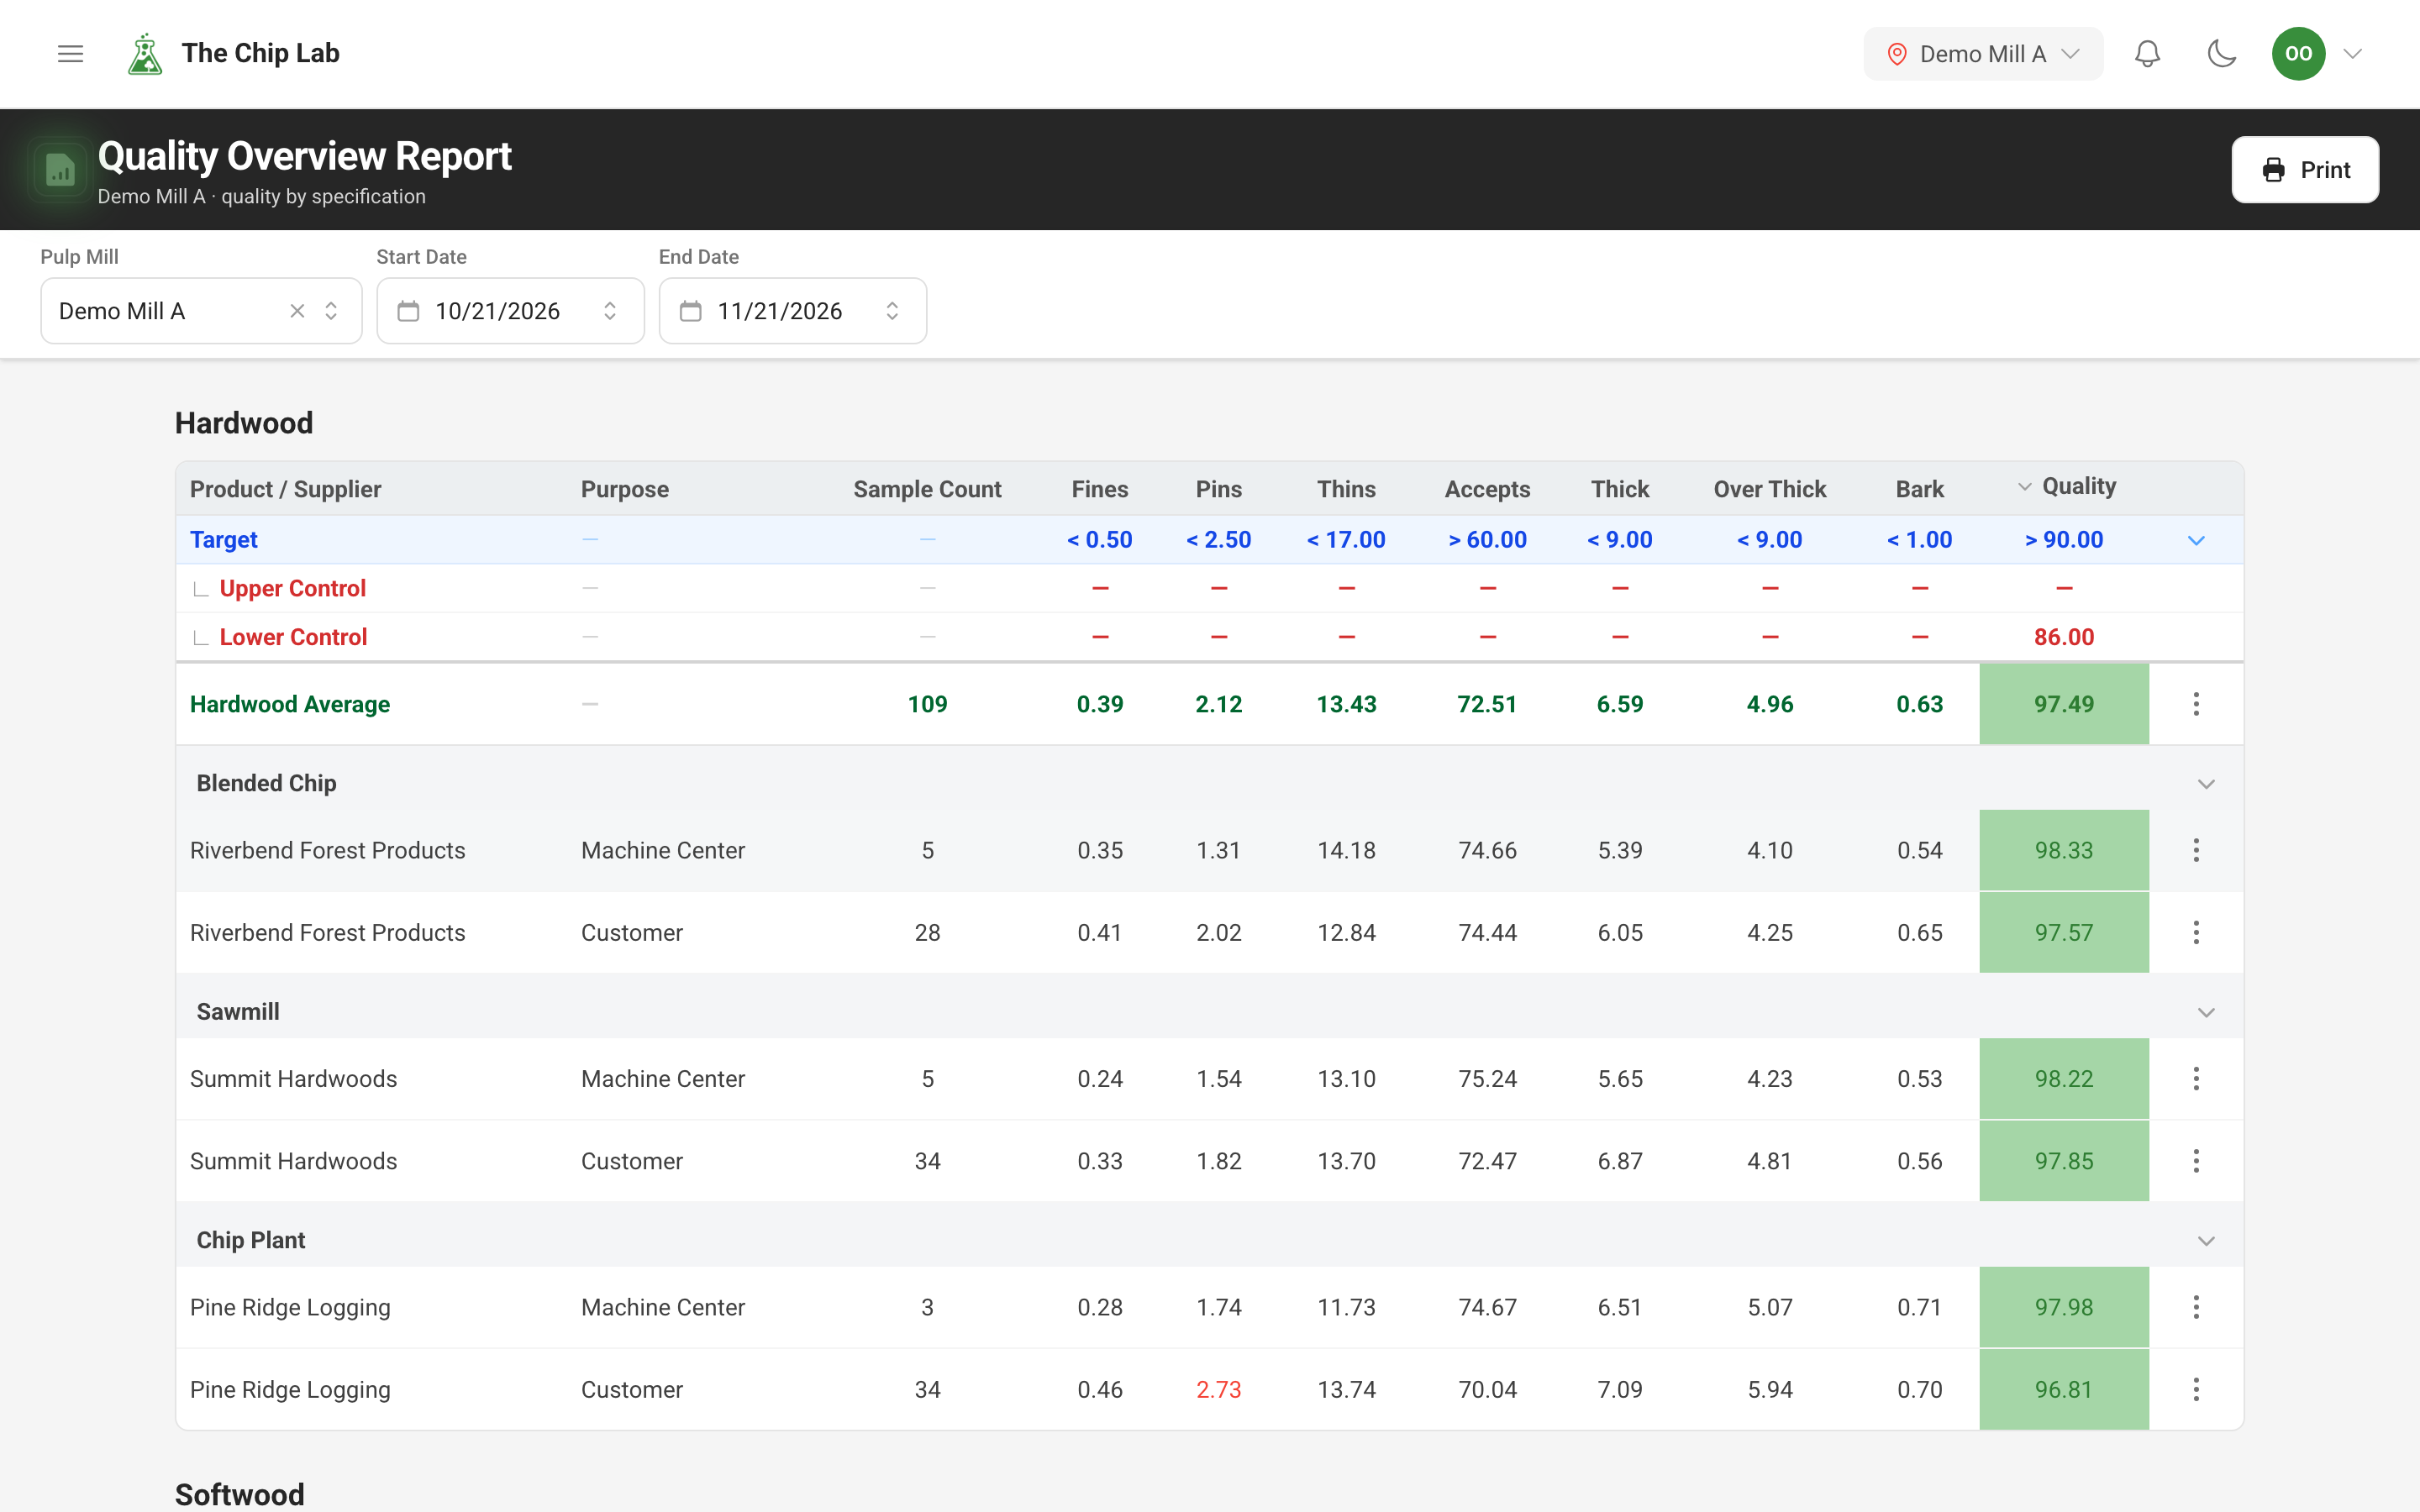
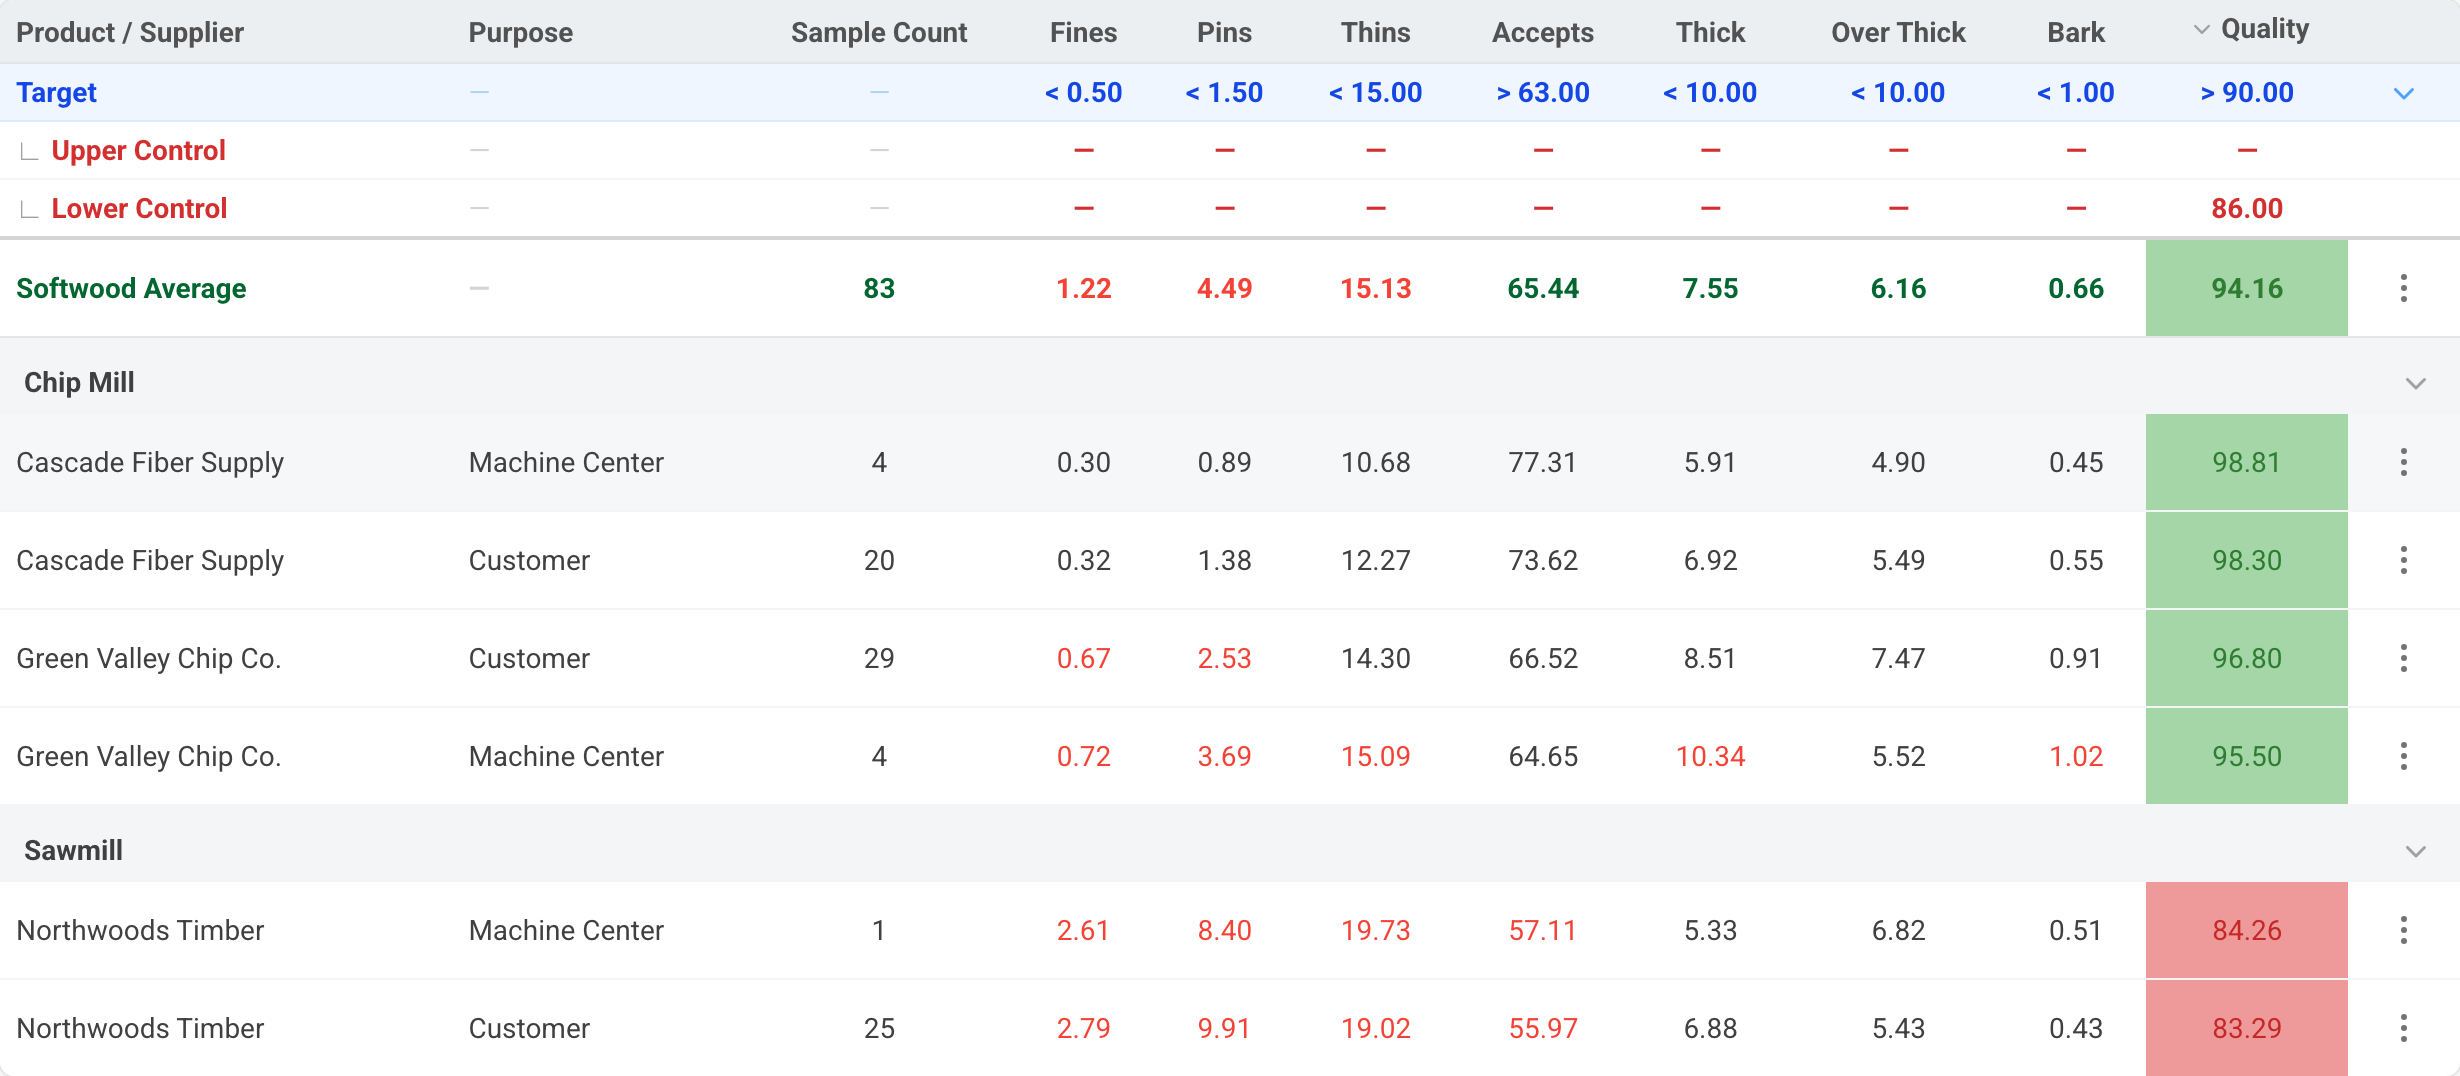
Pick a date range and press Generate Report. The report has one section for each of your specifications, such as hardwood and softwood, and each section reads from the top down.
- The Target row shows what the specification asks for. Click it to show or hide the Upper Control and Lower Control limits beneath it.
- An average row for the whole specification (Softwood Average, for example) follows, with the total sample count, so each supplier can be read against the mill's overall result. It averages the same samples the supplier rows below it are built from.
- Suppliers follow, grouped by product form (chip plant, blended chip, chip pile and so on), one row per supplier and sample purpose, best quality first.
- A value outside the target is shown in red. The quality score on the right is colored as good, ok or poor against your specification, the same colors used across the app.
- If your specifications calculate recoverable fiber, it has its own column, rated the same way.
Each product-form group collapses, so a long supplier list can be narrowed to the part you are discussing. Every row has a menu that opens the samples behind it. Print produces a clean report for a meeting or a supplier review. If your account covers more than one mill, clear the Pulp Mill field to run the report for all of them at once.
Quality Alerts
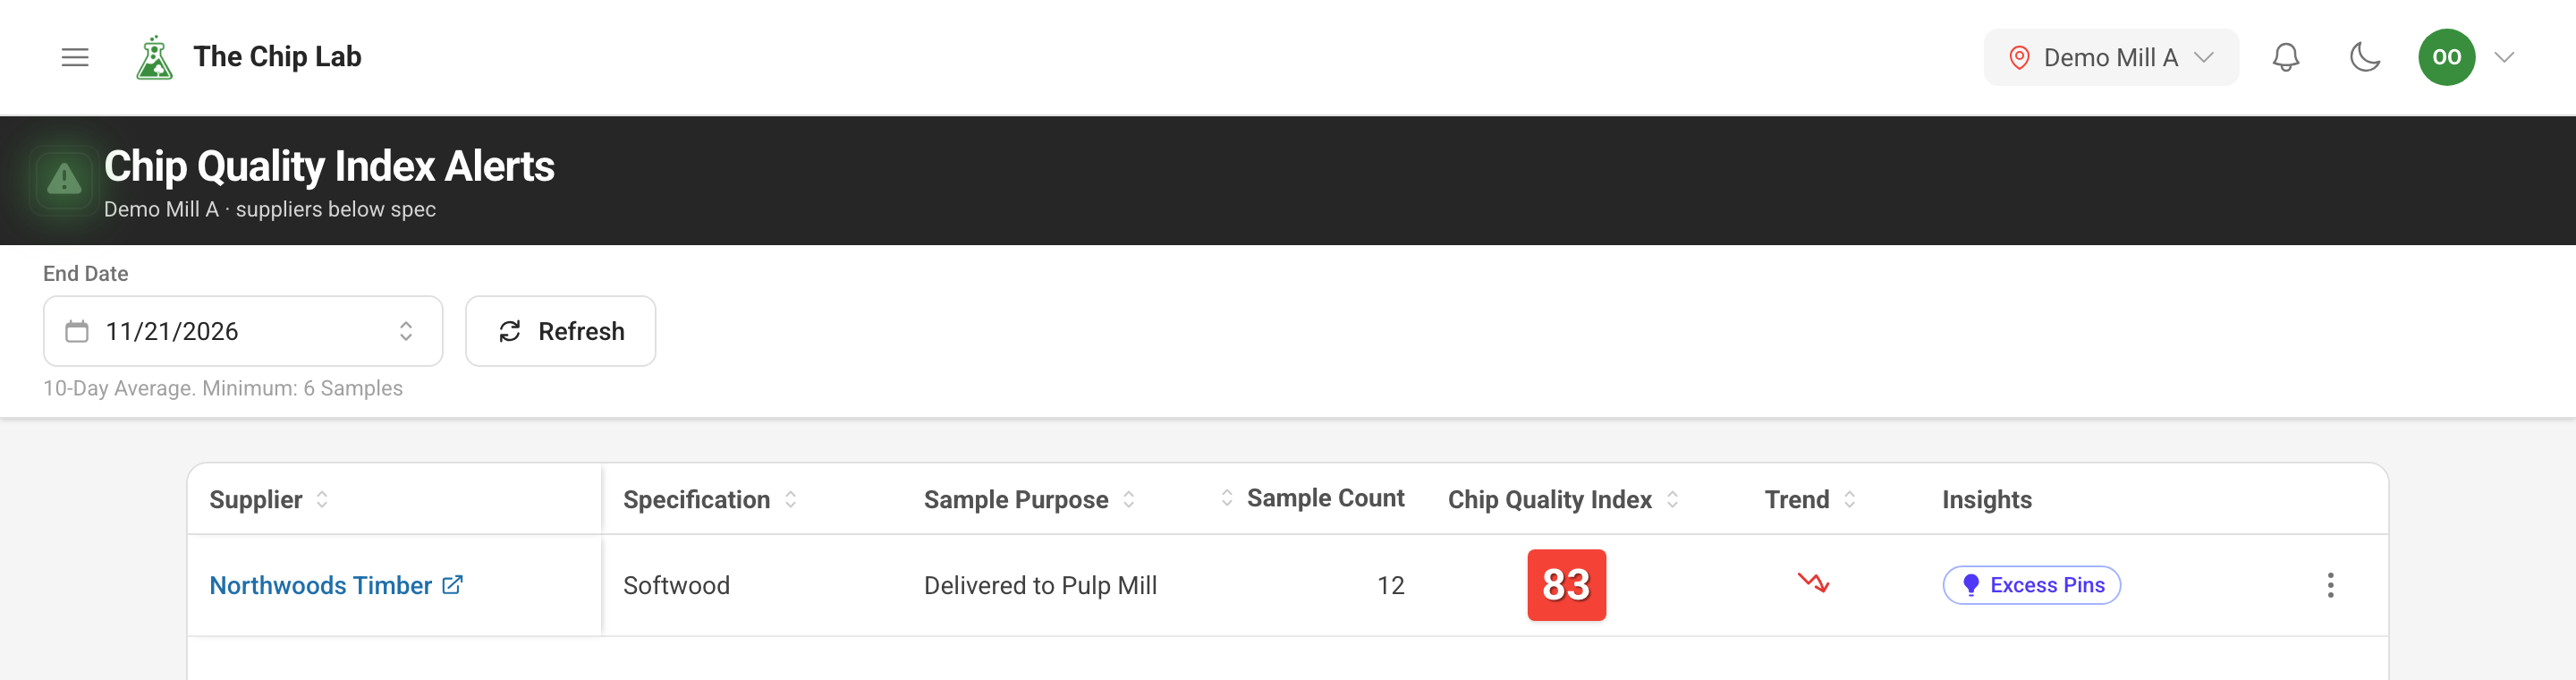
Quality Alerts answers the narrower question: over the last few days, which suppliers are running below target? The page is named for the metric your mill alerts on, for example Chip Quality Index Alerts, and lists each supplier, specification and sample purpose whose average over the alert window rates ok or poor, the worst at the top. Where your mill has set a minimum sample count, a row also needs at least that many samples in the window.
Each row shows the sample count, the average in its colored box, a Trend arrow that shows which way the supplier has been heading over the window, and Insights: short labels that flag the measurements outside the specification. That is usually the first thing to raise with the supplier. From the row menu you can open the supplier's samples — switch the sample window to Trend to see them one by one over time — or, with access to reports, open the supplier's report.
The length of the alert window and any minimum sample count are set for your mill with The Chip Lab team, and the page states them under the End Date. Change the end date to see what the list looked like on an earlier day.
From the dashboard
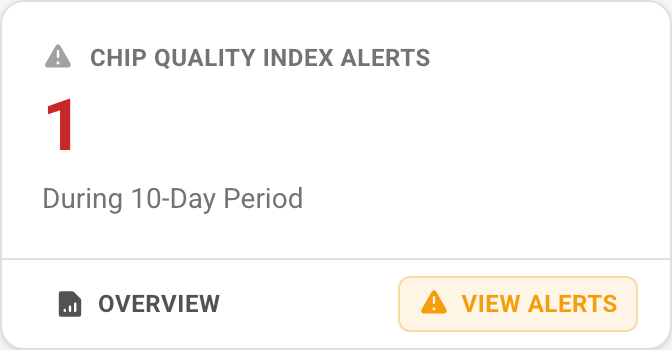
The dashboard carries an alerts tile with the count for the current window. View Alerts opens this list for the same date as the dashboard's As of picker, so the count on the tile matches the rows on the page. Overview beside it opens the Quality Overview Report.
The same section of the sidebar also holds Recoverable Fiber, which is currently marked as a preview.
Read next
- Mill dashboards — the at-a-glance view these reports sit behind.
- Chip specifications — the targets the rows are judged against.
- Chip quality alarms — be told when an average drifts past a limit.
- Ask the supplier — getting the supplier's equipment and contacts on file before the call.