
Mill dashboards for chip quality, on screen and on the wall
The first question at a mill each morning is a simple one: is the wood coming in good enough, and if not, whose is it? The answer usually lives in a lab spreadsheet, a few emails and somebody's memory. Chip quality affects pulp yield, so the answer should not take half an hour.
The dashboard is the first thing you see when you sign in to The Chip Lab. It puts the answer on one screen for your mill: how many samples came in, which suppliers are running below spec, what is waiting to be approved, and how each supplier is trending.
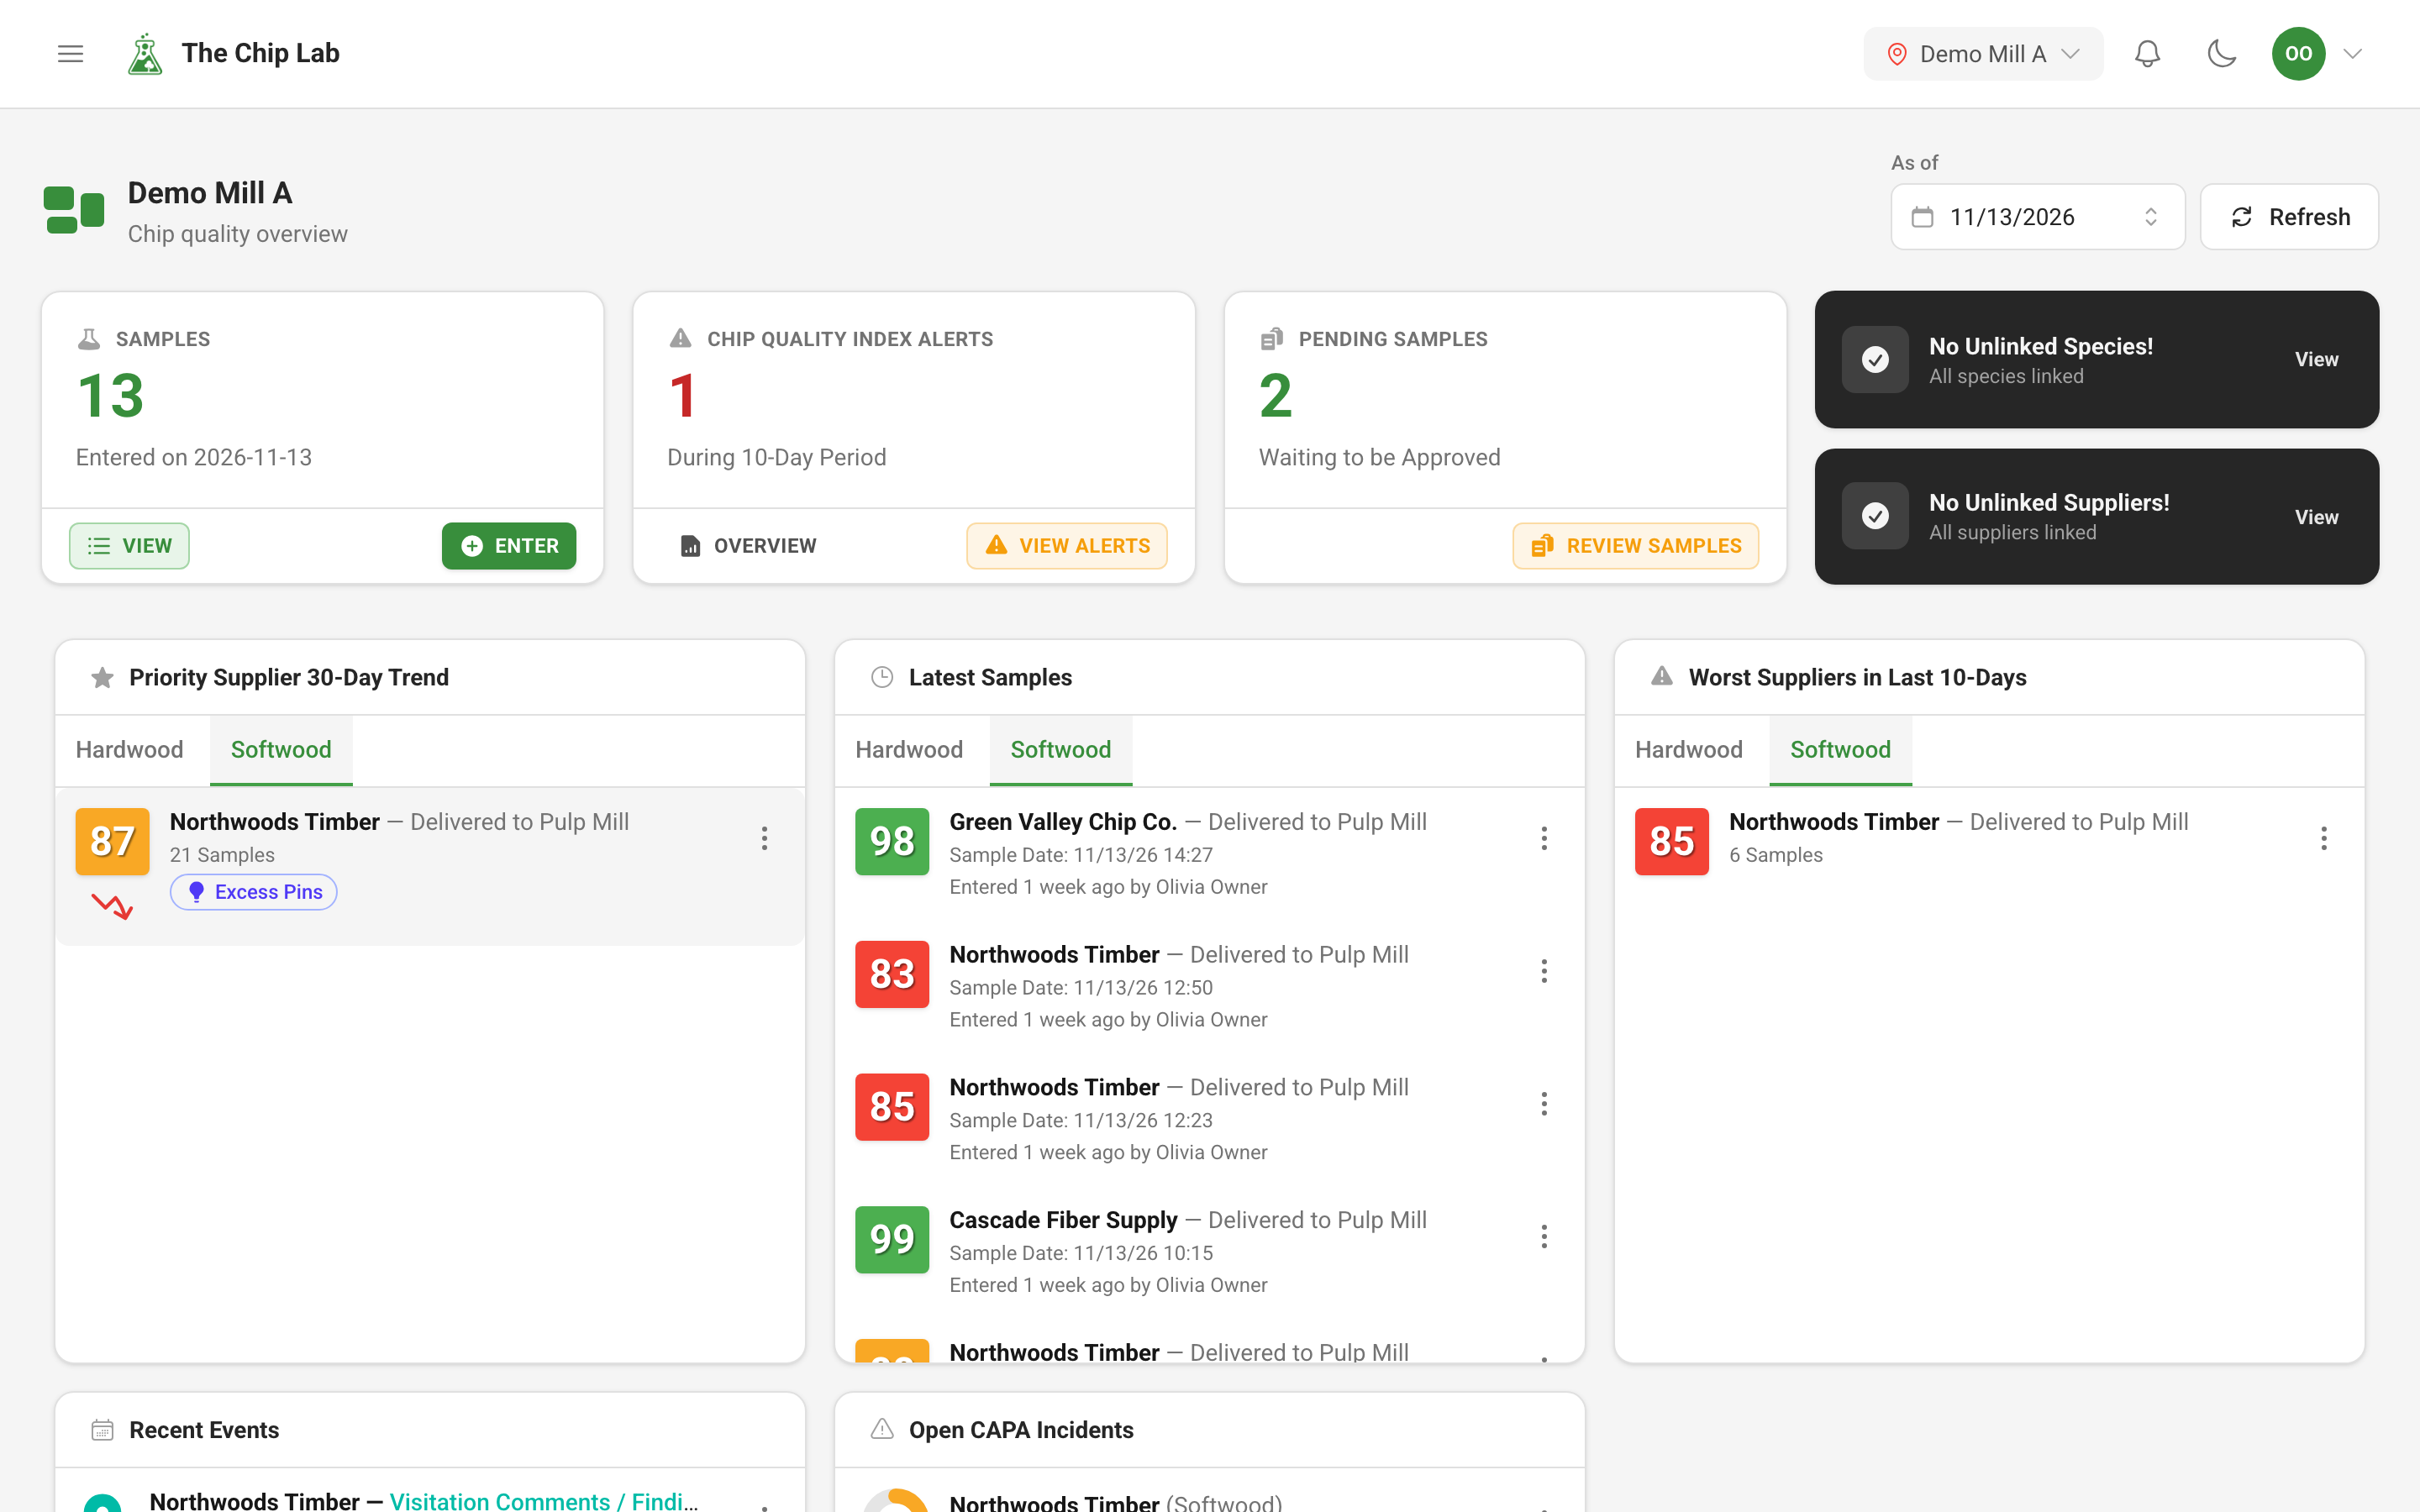
What is on it
Across the top, a row of tiles counts what needs attention, and each tile leads to the work:
- Today's Samples — samples entered today, with View to open them and Enter to add one.
- Alerts — named for the quality metric your mill alerts on (for example Chip Quality Index Alerts), it counts the suppliers, per specification and sample purpose, whose average over the mill's alert period rates ok or poor. View Alerts opens the list and Overview the Quality Overview Report.
- Pending Samples — samples waiting to be approved, with Review Samples, for people who review samples.
- Two status tiles, for account owners and administrators, that say whether incoming species or supplier names still need linking (the species one also needs mill-wide Chip Data at Manager).
When a questionnaire from The Chip Lab team is waiting on you, a Waiting on you banner sits above the tiles, listing who is waiting, and you can answer each question right there. It is not there otherwise. See Questionnaires.
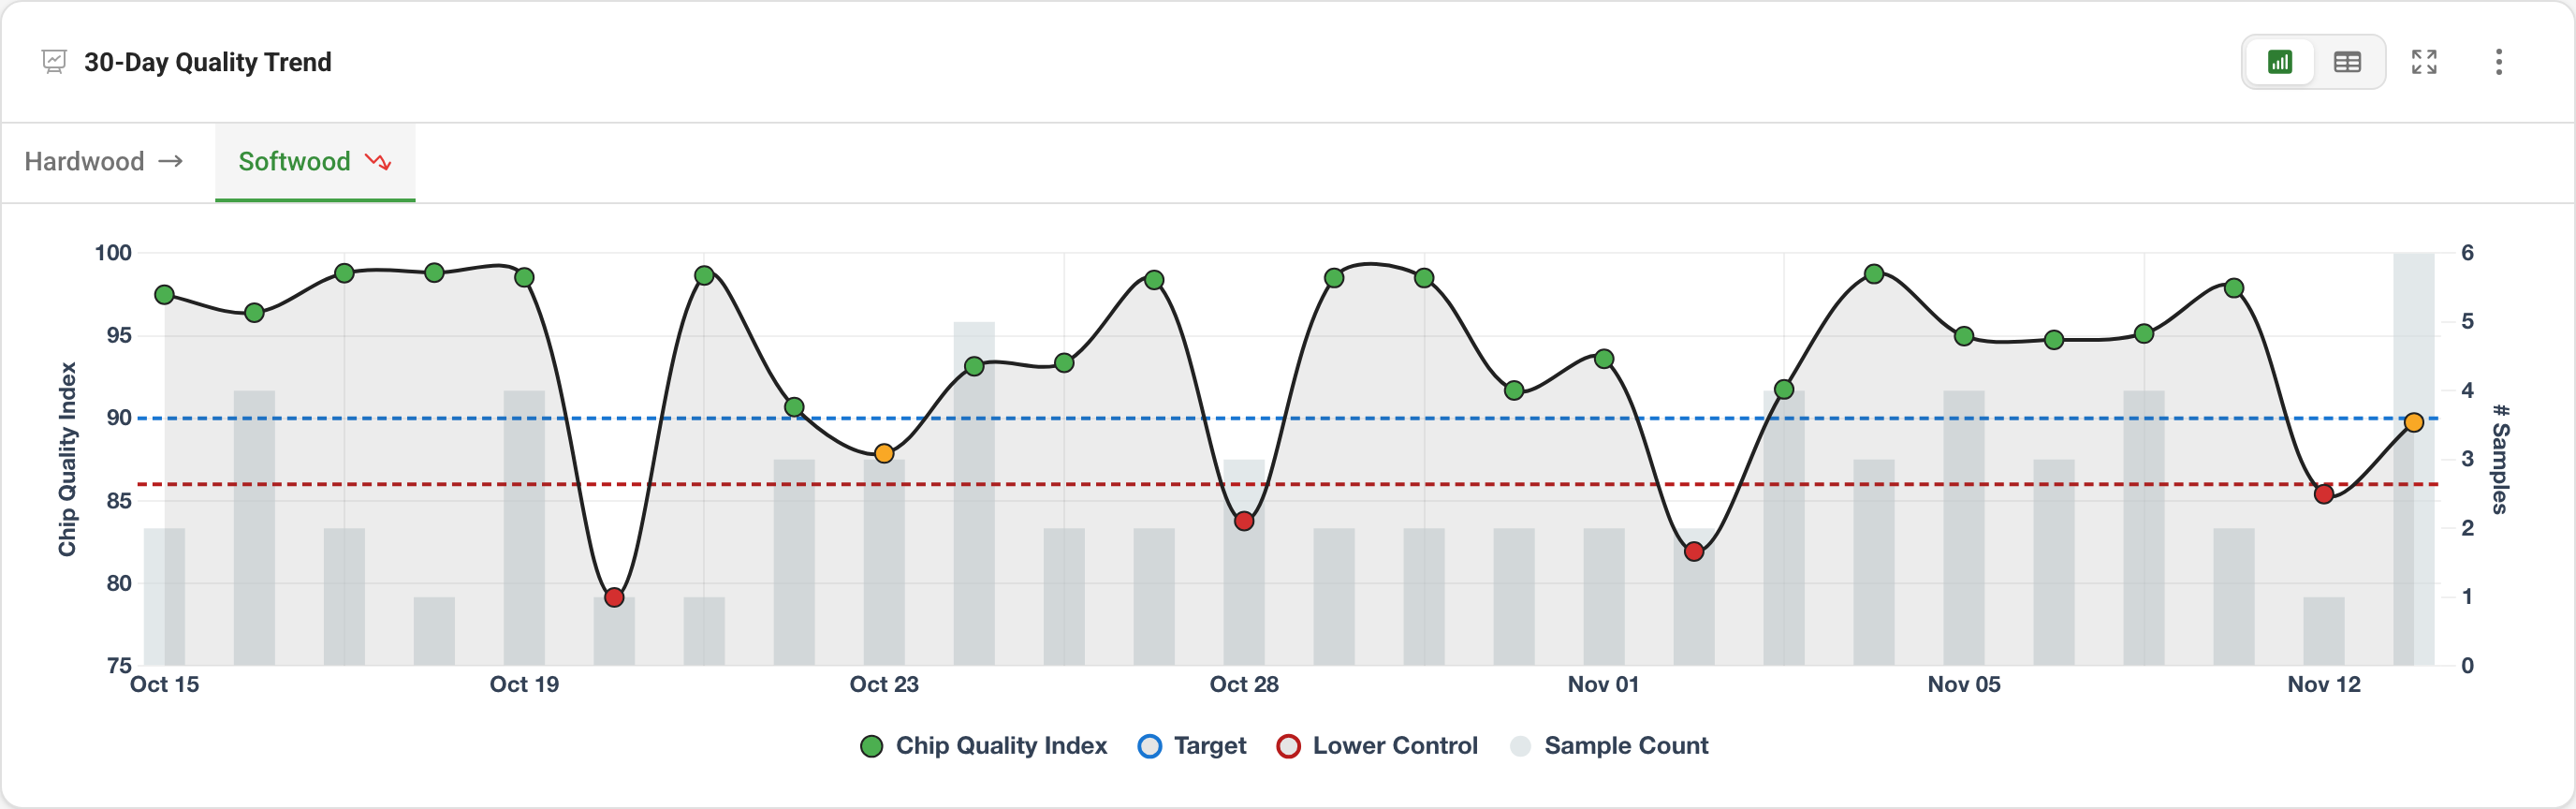
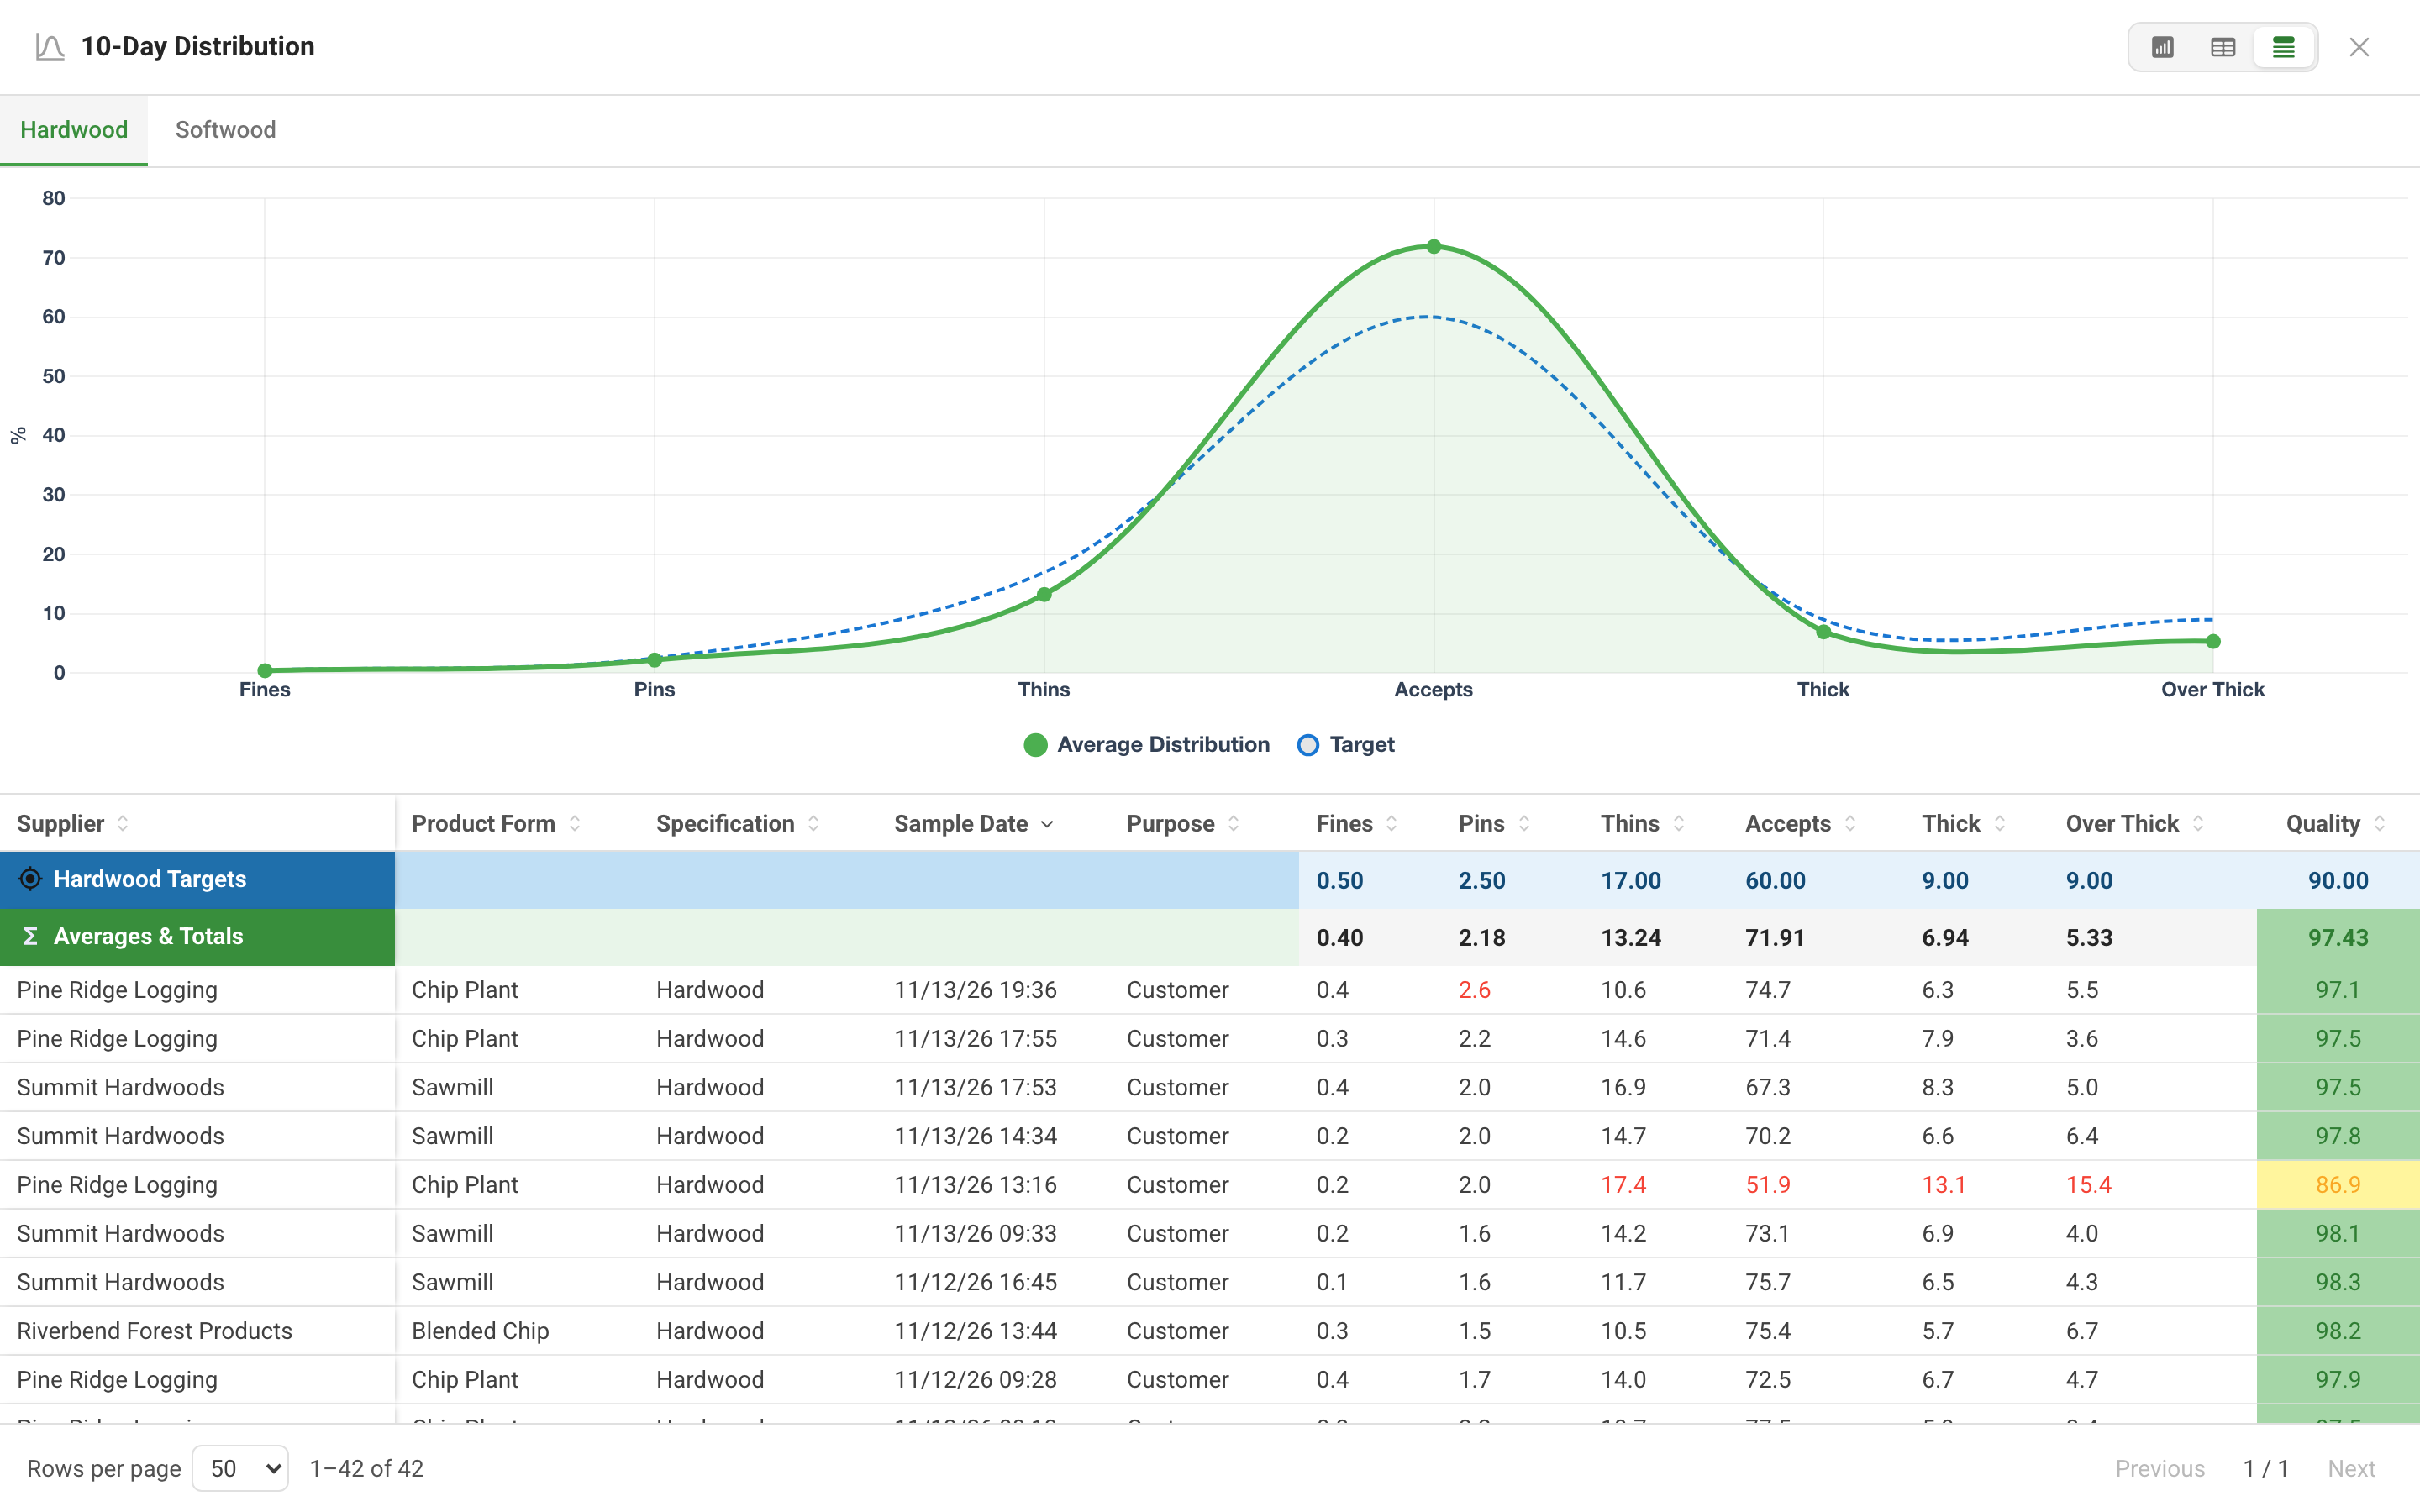
Below the tiles are the widgets: typically your priority suppliers' 30-day picture, the latest samples, the worst suppliers over the last ten days, recent events, a distribution chart against target and a quality trend over the last month. Each sample carries its quality score in a green, amber or red box. Supplier rows carry a trend arrow that points the way the supplier has been heading, and so do the quality trend's specification tabs. The worst-suppliers list ranks suppliers worst first by their average over the window; on chip quality it lists those whose average rates ok or poor. Mills with corrective action (CAPA) also see their open incidents.
Every list and chart has a menu for drilling in, and chart widgets open full screen with the samples behind them.
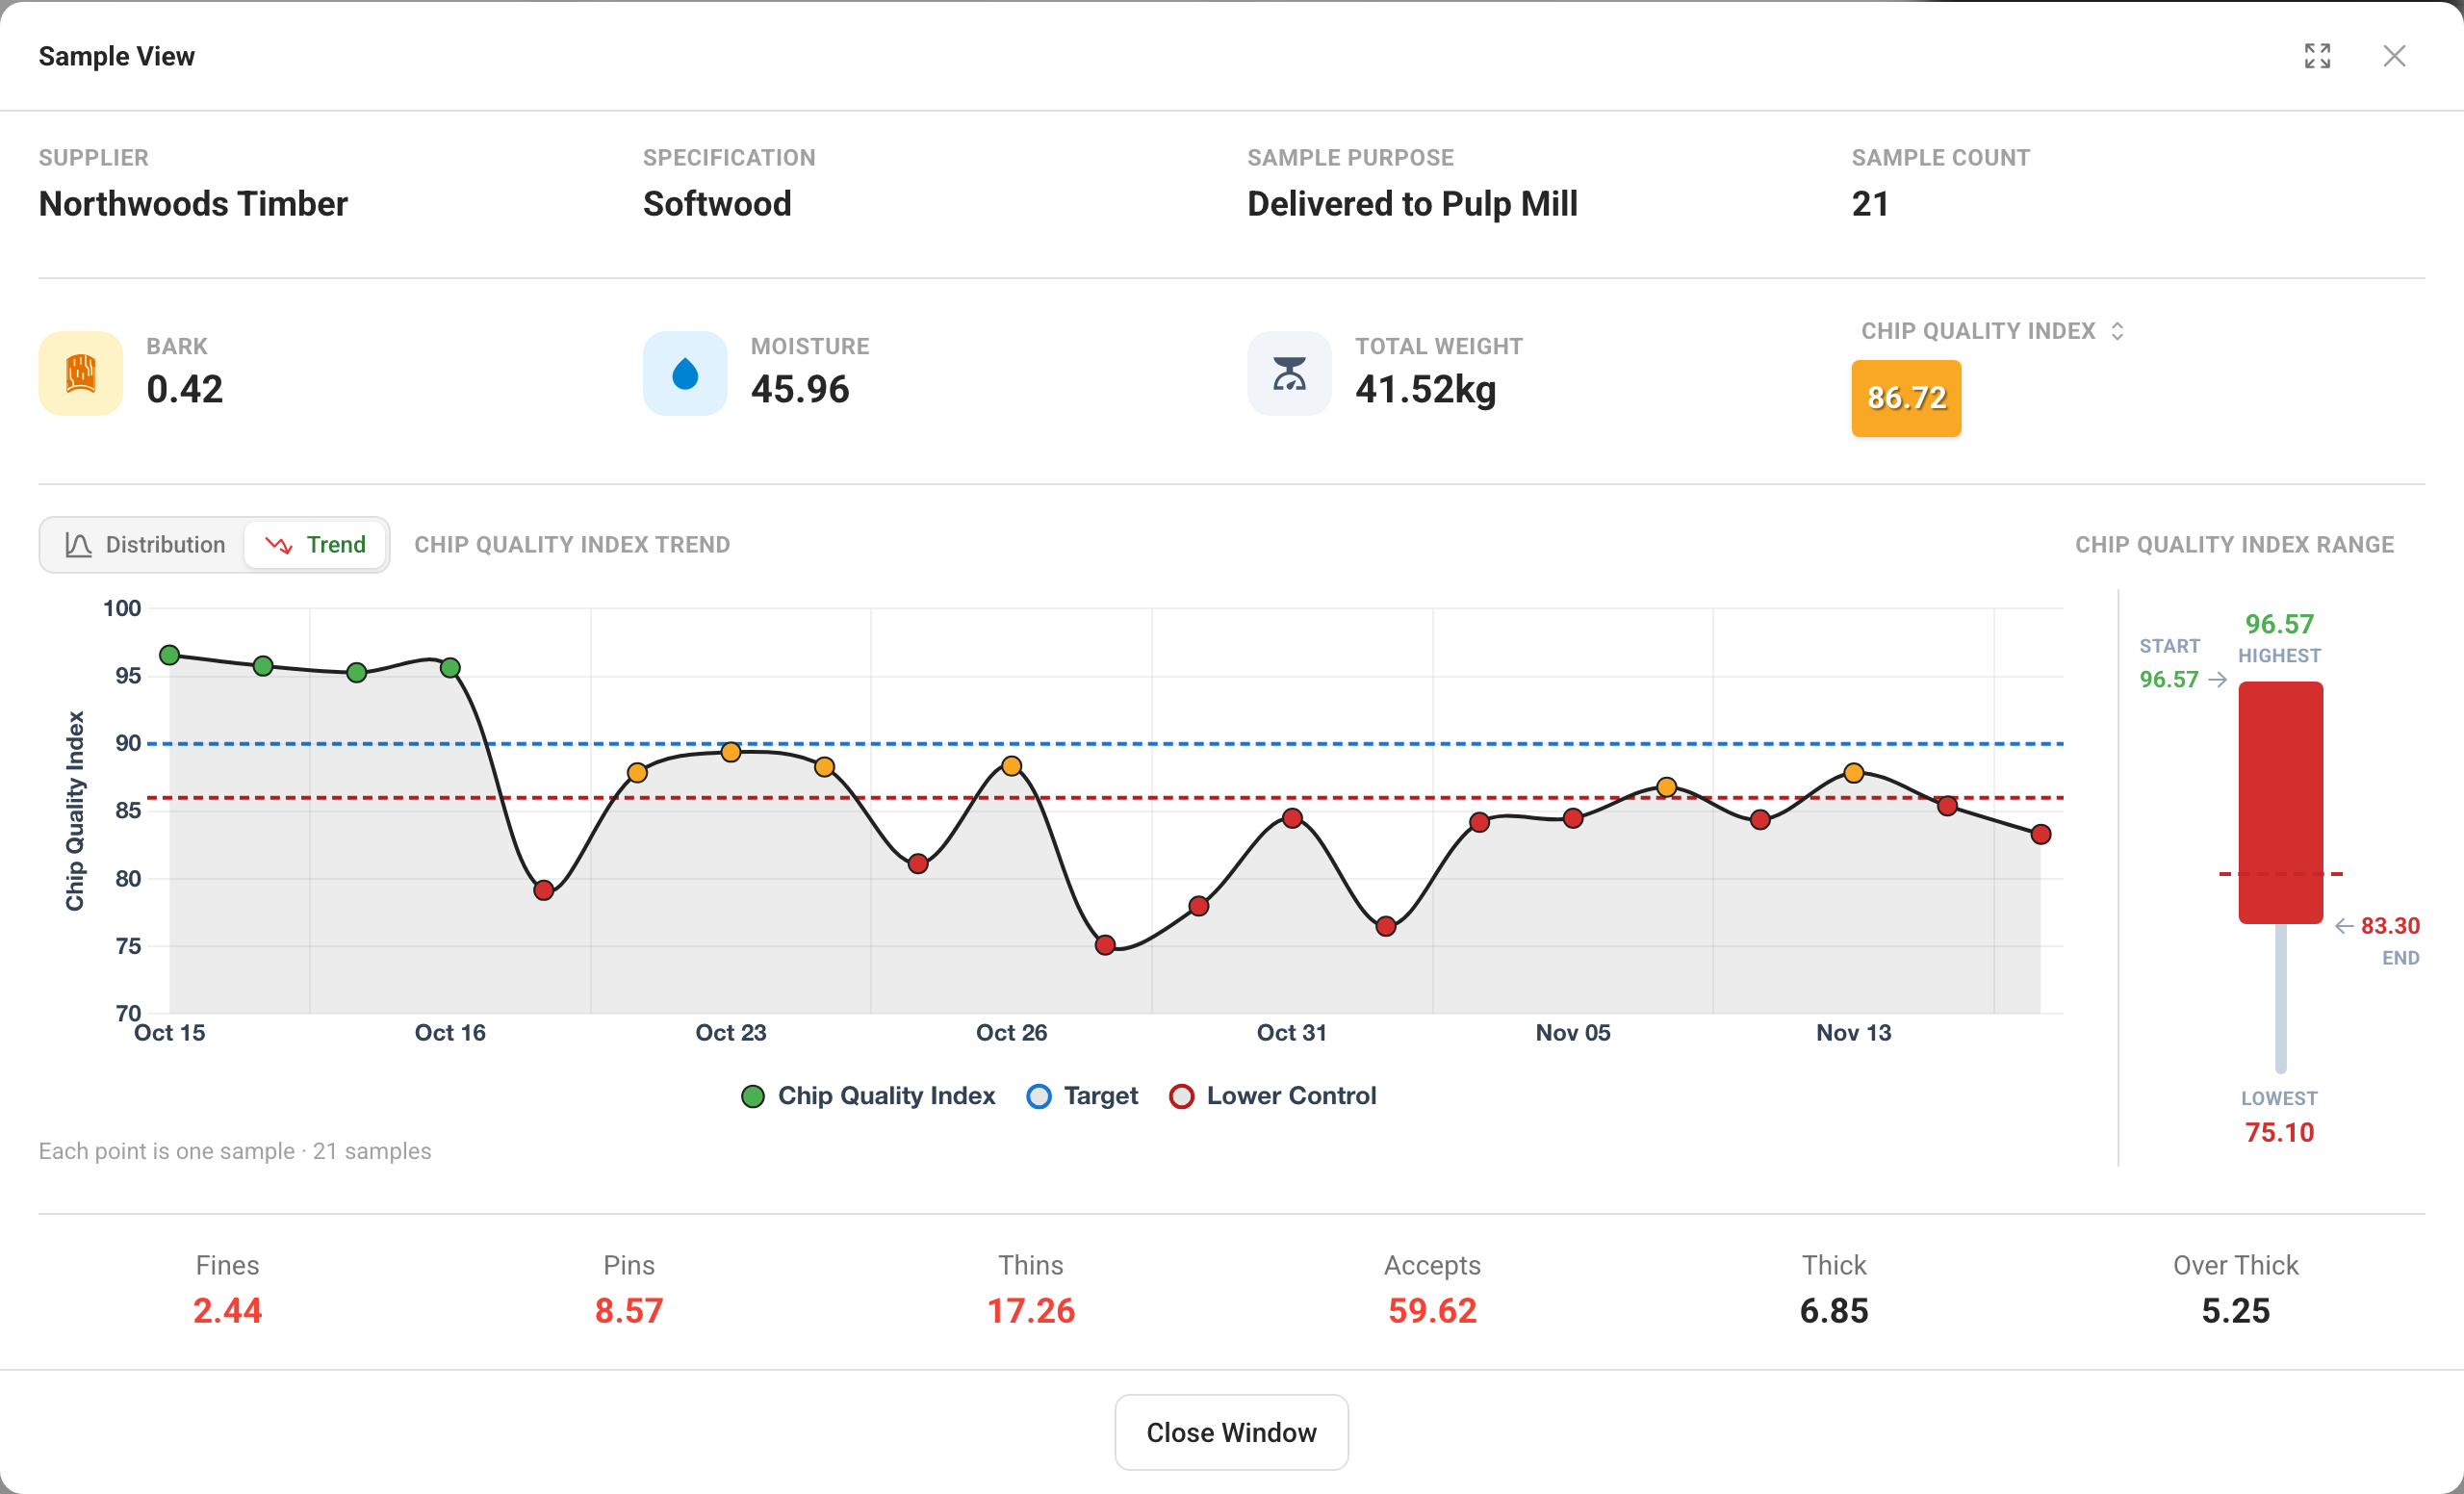
Opening a supplier's row shows its average in the Sample View window, as a distribution against target. Switch it to Trend to see the samples behind that average one by one over time, so you can tell a steady slide from one bad week.
Looking back with "As of"
The As of date in the top corner sets the whole dashboard to another day. Set it to last Tuesday and the ten-day and thirty-day views end on last Tuesday, Today's Samples becomes that day's samples, and View Alerts opens the alert list for the same period.
Built for your mill
Every mill starts with a standard dashboard. Others can be designed for how your mill works — a fiber-supply view, a lab view — and appear in the sidebar under Dashboards. The layout, widgets, filters and ranking metric are set up with The Chip Lab team. A widget or a whole page can be shown only to people with a given permission. Suppliers you mark as priority in the supplier editor appear in the priority suppliers widget.
What each person sees follows their access. Someone who enters samples but does not read the mill's results gets a Sample Entry tile instead of the sample tiles, and no sample widgets.
Pages that rotate, and the control-room TV
A dashboard can be split into pages — overview, suppliers, trends — shown as tabs or rotating on a timer with pause, previous and next controls. Rotation stops while you have a sample or a list open.
The same dashboard can run on a TV in the control room or the woodyard office. The display is paired once with a short code, set up with The Chip Lab team, and then shows one mill's dashboard full screen with no sign-in and no menus. It cannot change anything. It rotates through the pages, refreshes every few minutes, and shows when it last updated, flagging stale data. The Chip Lab team can revoke a display at any time.
Read next
- Quality Overview and Quality Alerts — where the alert tile leads.
- Questionnaires — answering questions from The Chip Lab team, from the dashboard banner.
- Ask the supplier — filling in supplier profiles without phone calls.